Top 3 Price Prediction Bitcoin, Ethereum, Ripple: Expect more from altcoins with BTC stuck in range trade
- Bitcoin price could drop all the way to $52,000 where many bulls wait to interact with BTC.
- Ethereum price consolidation in a falling wedge could send ETH to $3,750 as bulls defend $2,900 level.
- Ripple price eyes 5% correction, a mean reversal that could precipitate a strong move north.

Bitcoin (BTC) price remains range-bound with markets likely to endure a sideways weekend. The outlook is different for altcoins, however, as they try to break off from the BTC cues. Ethereum (ETH) and Ripple (XRP) prices could show more action even as markets wave off the halving excitement.
Also Read: Bitcoin Weekly Forecast: BTC’s next breakout could propel it to $80,000
Altcoins to show more action
Halving events often lead to increased interest and positive price movements for both Bitcoin and altcoins in the short term due to the anticipation of reduced supply. However, altcoins may experience more exaggerated price movements after a halving event compared to Bitcoin.
Some altcoins may see significant gains as investors shift their focus to alternative cryptocurrencies with potential for growth. On the other hand, some altcoins may struggle to maintain their value or face selling pressure as investors consolidate their positions into Bitcoin.
As Bitcoin price consolidates, forward-looking investors are already looking at altcoins.
#Altcoins
— Mikybull Crypto (@MikybullCrypto) April 25, 2024
Bitcoin breakout of the current consolidation range will initiate the maniac phase of Alts season.
BTC dominance is sending a clear message- a downtrend is imminent. pic.twitter.com/moQLzavmAg
Read More: A revisit of $56K is highly likely to shake weak hands before the next leg up for BTC
Bitcoin price needs a catalyst for momentum
Bitcoin price has been chopping sideways ahead of an eventful week starting Monday. For now, the odds lean in favor of the downside, with a low-hanging liquidity having an effective bearish pull on Bitcoin price.
With Bitcoin price suffering massive bearish momentum between the range of $65,500 and $69,000, the odds for further downside continue to increase. The yellow spikes on the volume profile show a lot of bullish activity waiting to interact with BTC around the $62,000 range. Should this area fail to hold as support, BTC could drop into the liquidity pool that extends between $60,600 and $59,005.
In a dire case, Bitcoin price could extend a leg down to $52,000, where multiple bulls await to interact with Bitcoin price. This would mean a fall of around 20% below current levels.
The Relative Strength Index (RSI) is recording lower highs that have seen it drop below the mean level of 50. Coupling this with the position of the Moving Average Convergence Divergence (MACD) in negative territory, what follows next could be a fall before a possible recovery.
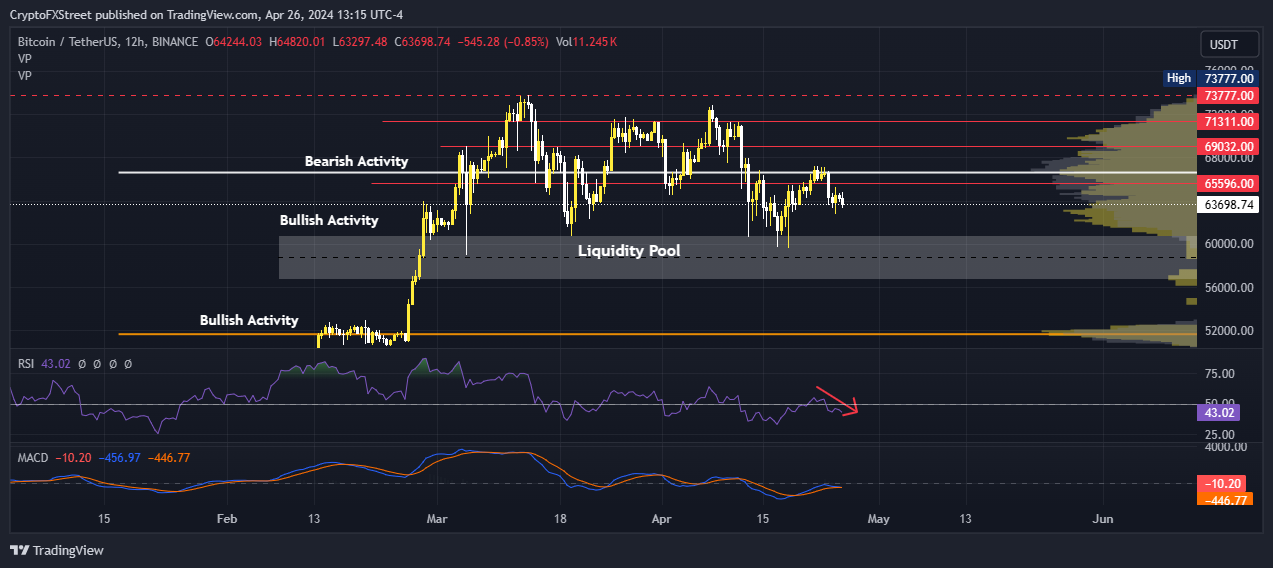
BTC/USDT 12-hour chart
On the other hand, if the area around $62,000 holds as support, with multiple bulls also waiting to buy BTC, Bitcoin price could recover. For confirmation of an uptrend, BTC price must record a candlestick close above $69,032. Such a move would pave the way for a retake of the $73,777 peak or set the tone for a new all-time high.
Ethereum price’s falling wedge precipitates a bullish reversal
Ethereum price is consolidating within a falling wedge pattern, a bullish reversal technical formation that will be executed with a breakout above the upper trendline. With a lot of bullish activity waiting to interact with ETH just above the $2,900 level, Ethereum price could reverse or bounce above this base.
Notice the lower highs on the RSI, reinforced by the MACD holding above the signal line. Investors looking to take long positions for ETH should wait for both these momentum indicators to close above their respective mean levels decisively in the 12-hour time frame. A breakout could see ETH nick the $3,750 threshold as it chases the nearly 25% target objective of the descending wedge around the $4,290 level.
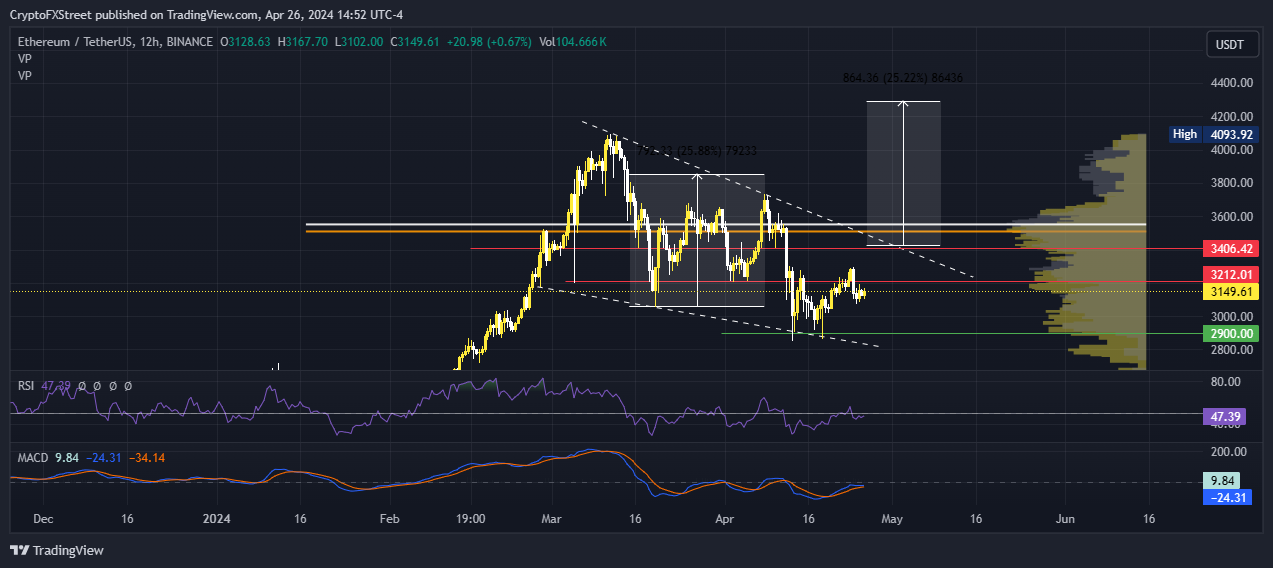
ETH/USDT 12-hour chart
On the other hand, if the $2,900 level fails to hold as support, the Ethereum price could spiral to the $2,800 level where bulls are expected to step in based on spikes on the volume nodes.
Also Read: Ethereum cancels rally expectations as Consensys sues SEC over ETH security status
Ripple price could fall 5% before correction
Ripple price is scaling a recovery rally as it holds in the upper section of the market range. Before a further upside, however, XRP price is likely to retest the 50% Fibonacci placeholder at $0.4952 before a pullback toward the $0.6000 psychological level.
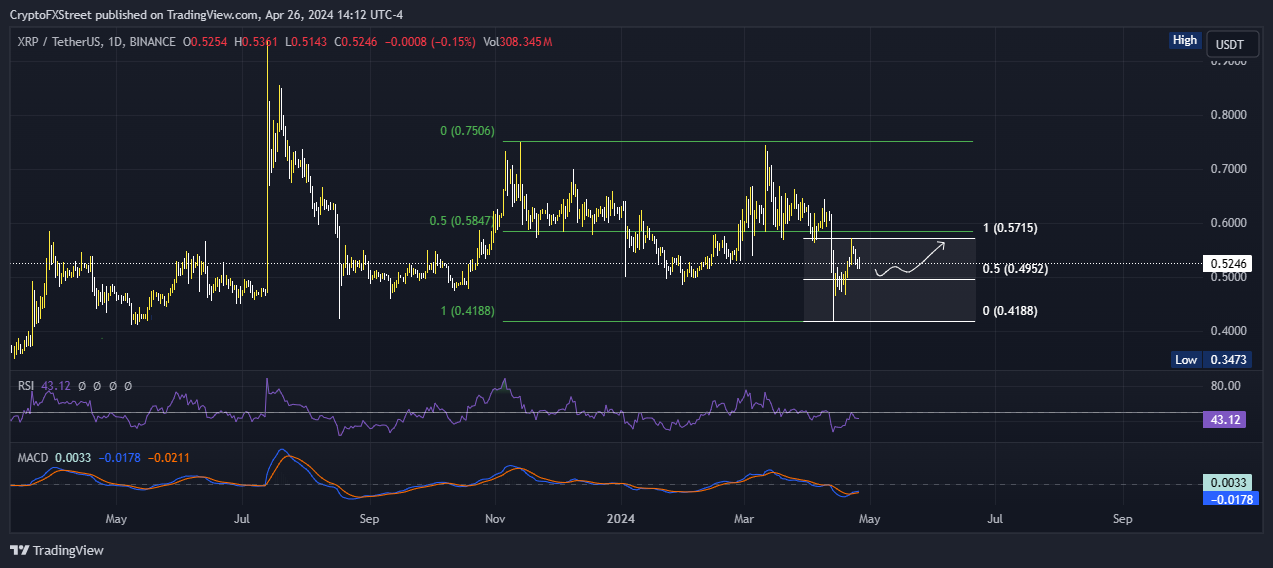
XRP/USDT 1-day chart
Conversely, if the $0.4952 level fails to hold as a support, XRP price could extend the fall to the bottom of the market range at $0.4188. A break and close below this level would invalidate the bullish thesis.
Also Read: XRP hovers near $0.50 as Ripple CTO addresses concerns related to stablecoin launch
Cryptocurrency prices FAQs
Token launches like Arbitrum’s ARB airdrop and Optimism OP influence demand and adoption among market participants. Listings on crypto exchanges deepen the liquidity for an asset and add new participants to an asset’s network. This is typically bullish for a digital asset.
A hack is an event in which an attacker captures a large volume of the asset from a DeFi bridge or hot wallet of an exchange or any other crypto platform via exploits, bugs or other methods. The exploiter then transfers these tokens out of the exchange platforms to ultimately sell or swap the assets for other cryptocurrencies or stablecoins. Such events often involve an en masse panic triggering a sell-off in the affected assets.
Macroeconomic events like the US Federal Reserve’s decision on interest rates influence risk assets like Bitcoin, mainly through the direct impact they have on the US Dollar. An increase in interest rate typically negatively influences Bitcoin and altcoin prices, and vice versa. If the US Dollar index declines, risk assets and associated leverage for trading gets cheaper, in turn driving crypto prices higher.
Halvings are typically considered bullish events as they slash the block reward in half for miners, constricting the supply of the asset. At consistent demand if the supply reduces, the asset’s price climbs. This has been observed in Bitcoin and Litecoin.
Author

Lockridge Okoth
FXStreet
Lockridge is a believer in the transformative power of crypto and the blockchain industry.


