Top 3 Price Prediction Bitcoin, Ethereum, Ripple: ETH and XRP take point while BTC takes backseat
- Bitcoin price to retrace toward the 50% Fibonacci retracement level at $51,600 after the MRI flashed a cycle top signal.
- Ethereum price seems ready for another leg up after a minor dip.
- XRP price is primed to retest recent swing highs at $1.70.

Bitcoin price shows that a correction is still underway, but Ethereum and XRP seem to be gearing up for a move higher.
Bitcoin price nearing correction
Bitcoin price showed exhaustion of buyers before hitting a local top at $57,184 due to the Momentum Reversal Indicator’s (MRI) reversal signal in the form of a red ‘one’ candlestick.
This setup forecasts a reversal in a trend that may extend from one to four candlesticks. This pullback is likely to bounce from the 50% Fibonacci retracement level at $51,600. However, if the sellers break down this barrier, then the demand zone ranging from $50,128 to $51,005 will serve as a foothold for the buyers to make a comeback.
This leg up might allow Bitcoin price to retest the swing top at $58,354. Such a move will open up the path to retest the all-time high at $61,417.
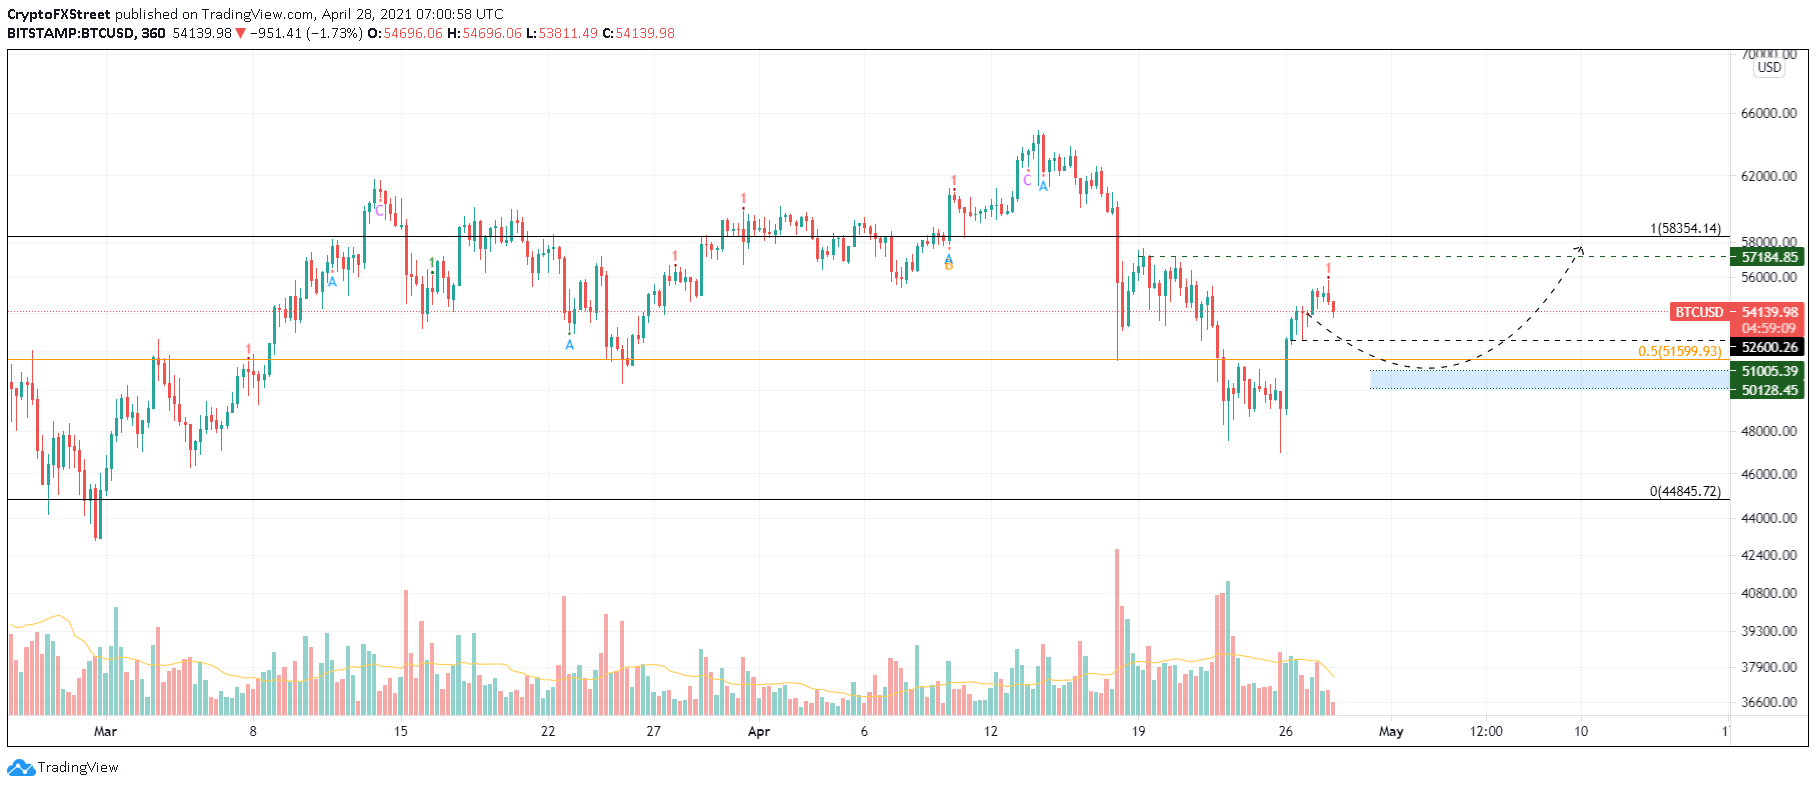
BTC/USD 6-hour chart
On the flip side, if buyers fail to rescue the flagship from either of the mentioned support levels, the bullish thesis will face invalidation. In that case, investors can expect a 5% retracement to $47,436.
Ethereum price on the verge of another rally
Ethereum price is ahead of the curve as it is already near its pullback target around $2,543. Hence, if buyers decide to scoop up the smart contract token at a discounted price, it could trigger a move to the recently set up all-time highs at $2,716.
If this were to happen, sidelined investors might jump on the ETH bandwagon due to FOMO and propel it higher. The 162% Fibonacci extension level at around $3,000 seems to be the next target for investors.
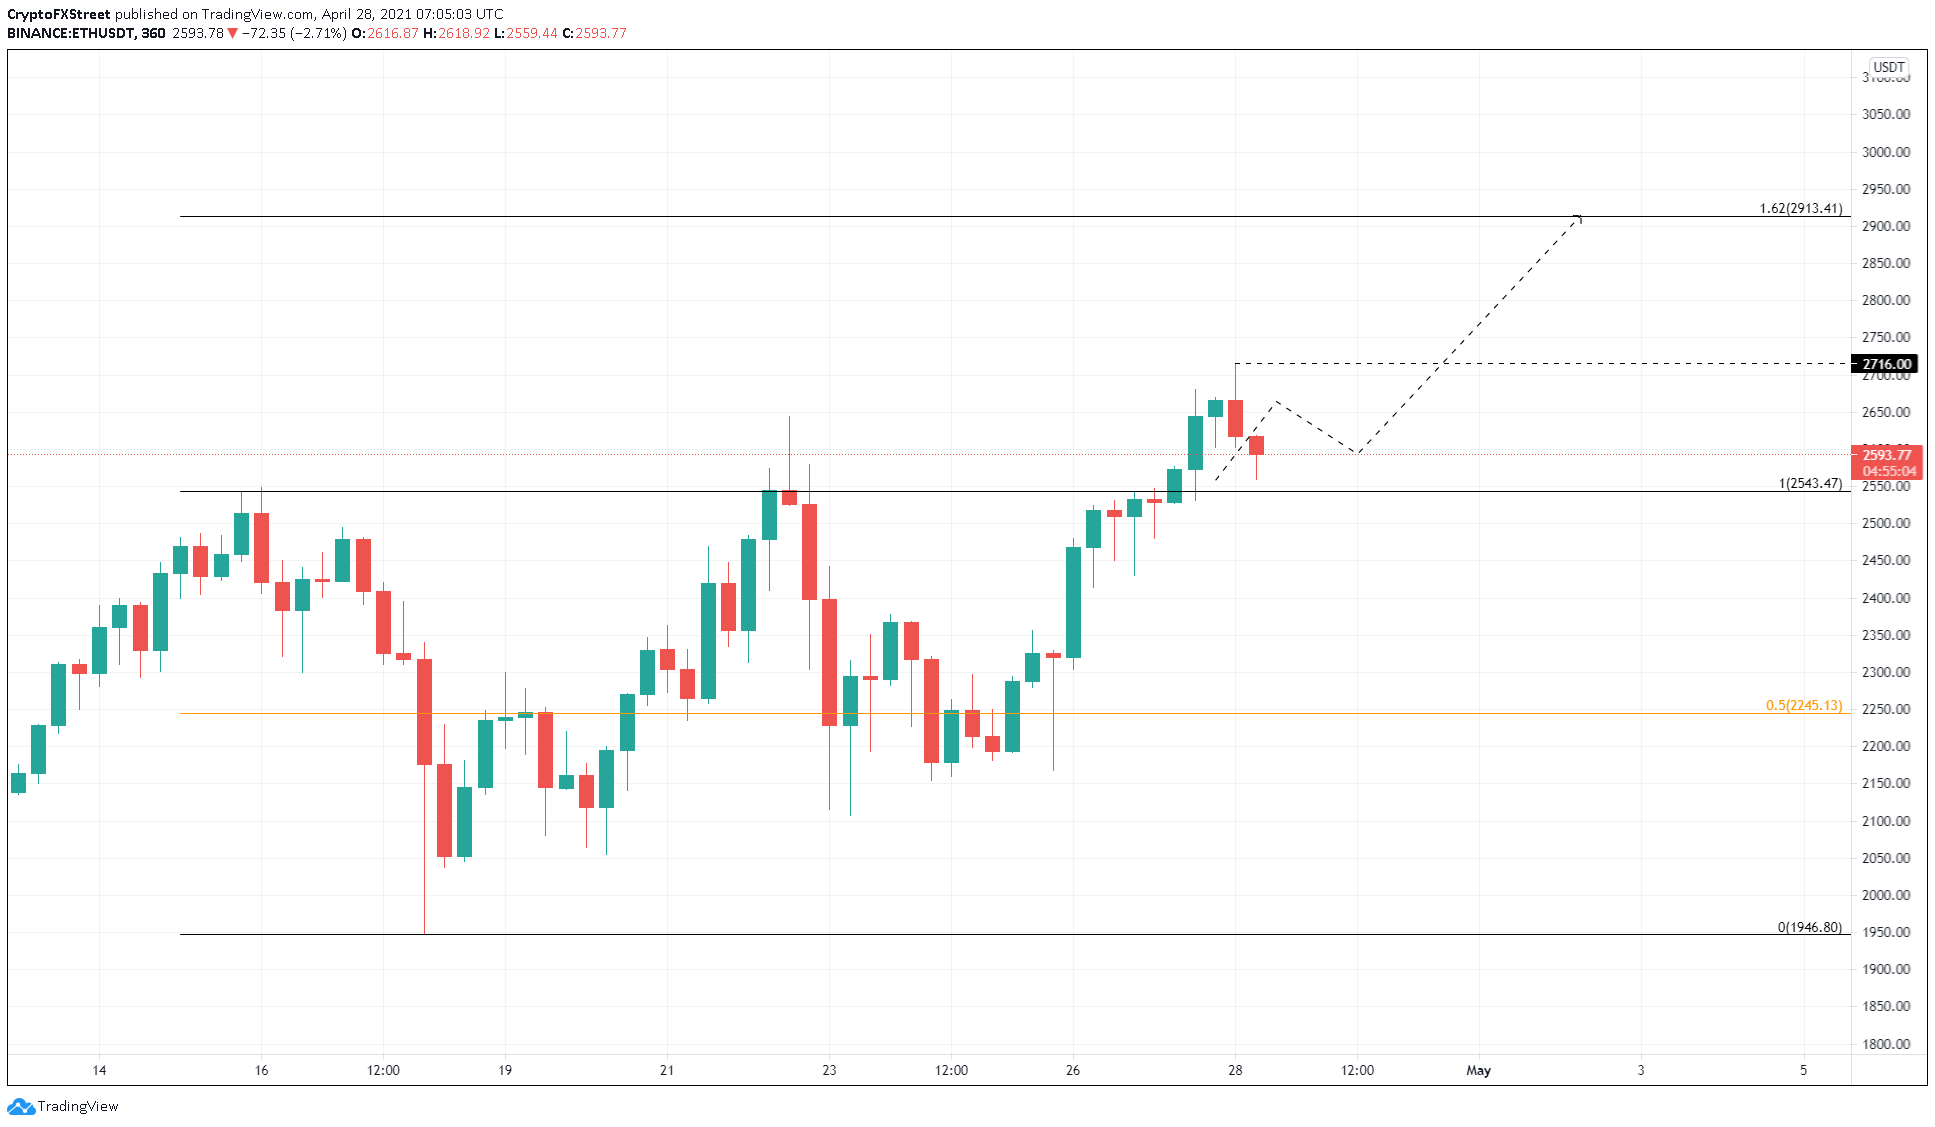
ETH/USDT 6-hour chart
While things seem to be going up for Ethereum price, a sudden spike in selling pressure that ETH below the support level at $2,543 would put the upside narrative in jeopardy.
A breakdown of the demand barrier at $2,425 would invalidate the bullish outlook and kickstart a correction to $2,328 or the 50% Fibonacci retracement level at $2,245.
Ripple readies itself for bull rally
XRP price faced rejection around the swing high at $1.49, which resulted in a pullback to the 50% Fibonacci retracement level at $1.32. Now, a bounce from this level would allow the buyers to take another jab at $1.49.
Should the bullish momentum be enough to slice through this barrier, XRP price would target the 161.8% Fibonacci extension level at $1.69. If the bid orders keep piling up, $1.82 could be the next area of interest for investors.
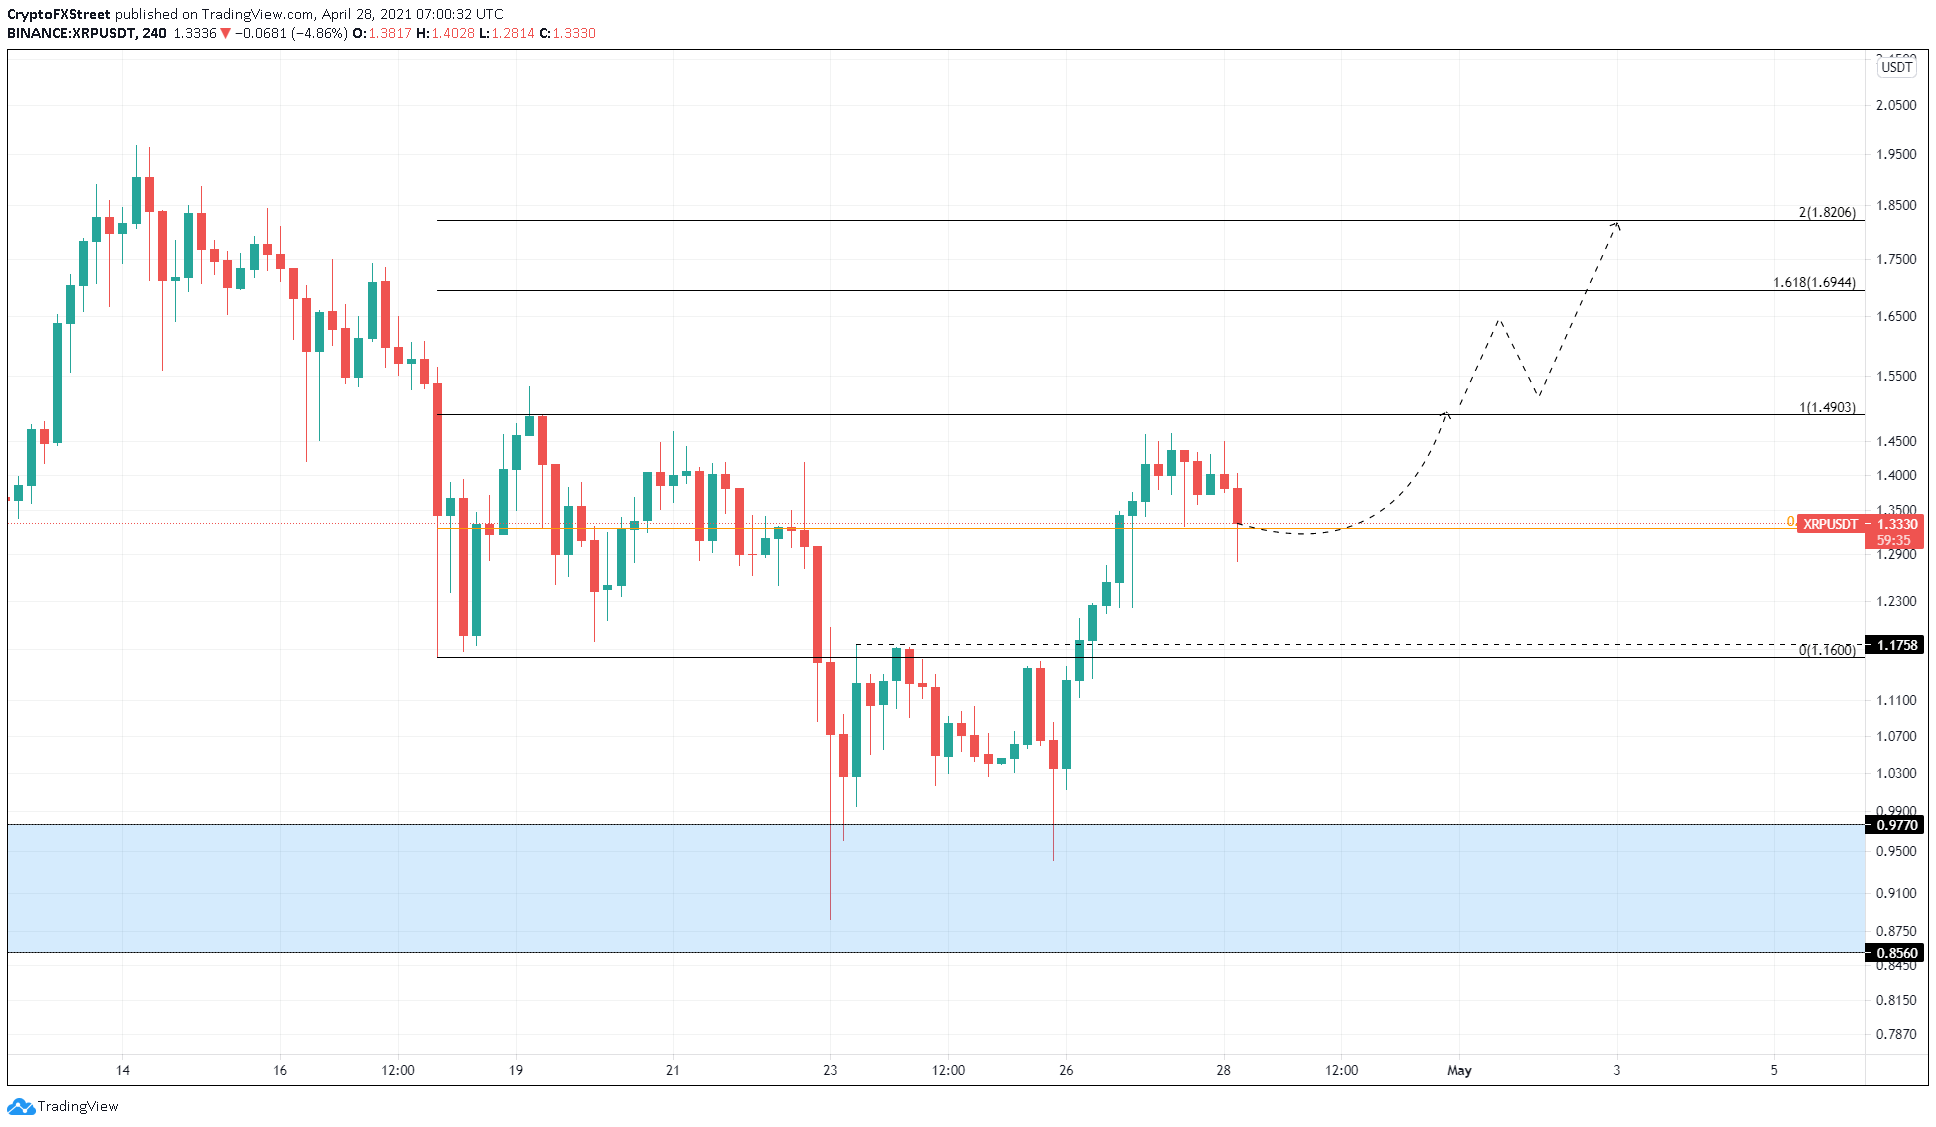
XRP/USDT 4-hour chart
Ripple’s bullish thesis depends on a bounce from $1.32. Therefore, a sudden burst of selling pressure that breaks down this barrier will invalidate the optimistic narrative surrounding XRP and lead to a 6% pullback to $1.24.
Author

Akash Girimath
FXStreet
Akash Girimath is a Mechanical Engineer interested in the chaos of the financial markets. Trying to make sense of this convoluted yet fascinating space, he switched his engineering job to become a crypto reporter and analyst.



