Bitcoin Price Prediction: BTC is one resistance level away from taking jab at all-time highs
- Bitcoin price has surged nearly 12% in under 48 hours, signifying a resurgence of buyers.
- While bullish, BTC is likely to retrace to an immediate demand zone before creating a swing high.
- On-chain metrics point to a gradual increase in investor interest.

Bitcoin price has appreciated vastly over the last couple of hours, pushing it toward a previous swing point. Before proceeding higher, BTC could most likely retrace, which will provide bulls with an opportunity to recuperate for the next leg up.
Bitcoin price looks bullish on bigger picture
Bitcoin price shows a resurgence of buyers, which has propelled it 9% higher in a single 12-hour candlestick from $49,122 to $53,795. Now, BTC is trading around the previous swing high at $54,530, suggesting a slowdown in its momentum.
Hence, investors can expect a minor pullback to the demand zone that ranges from $50,128 to $51,005. This retracement will allow the buyers to recuperate strength for the next leg up, potentially creating a higher high around the resistance barrier at $57,184.
A decisive close above this level could set the stage for the next ascent to retest the all-time high at $64,895.
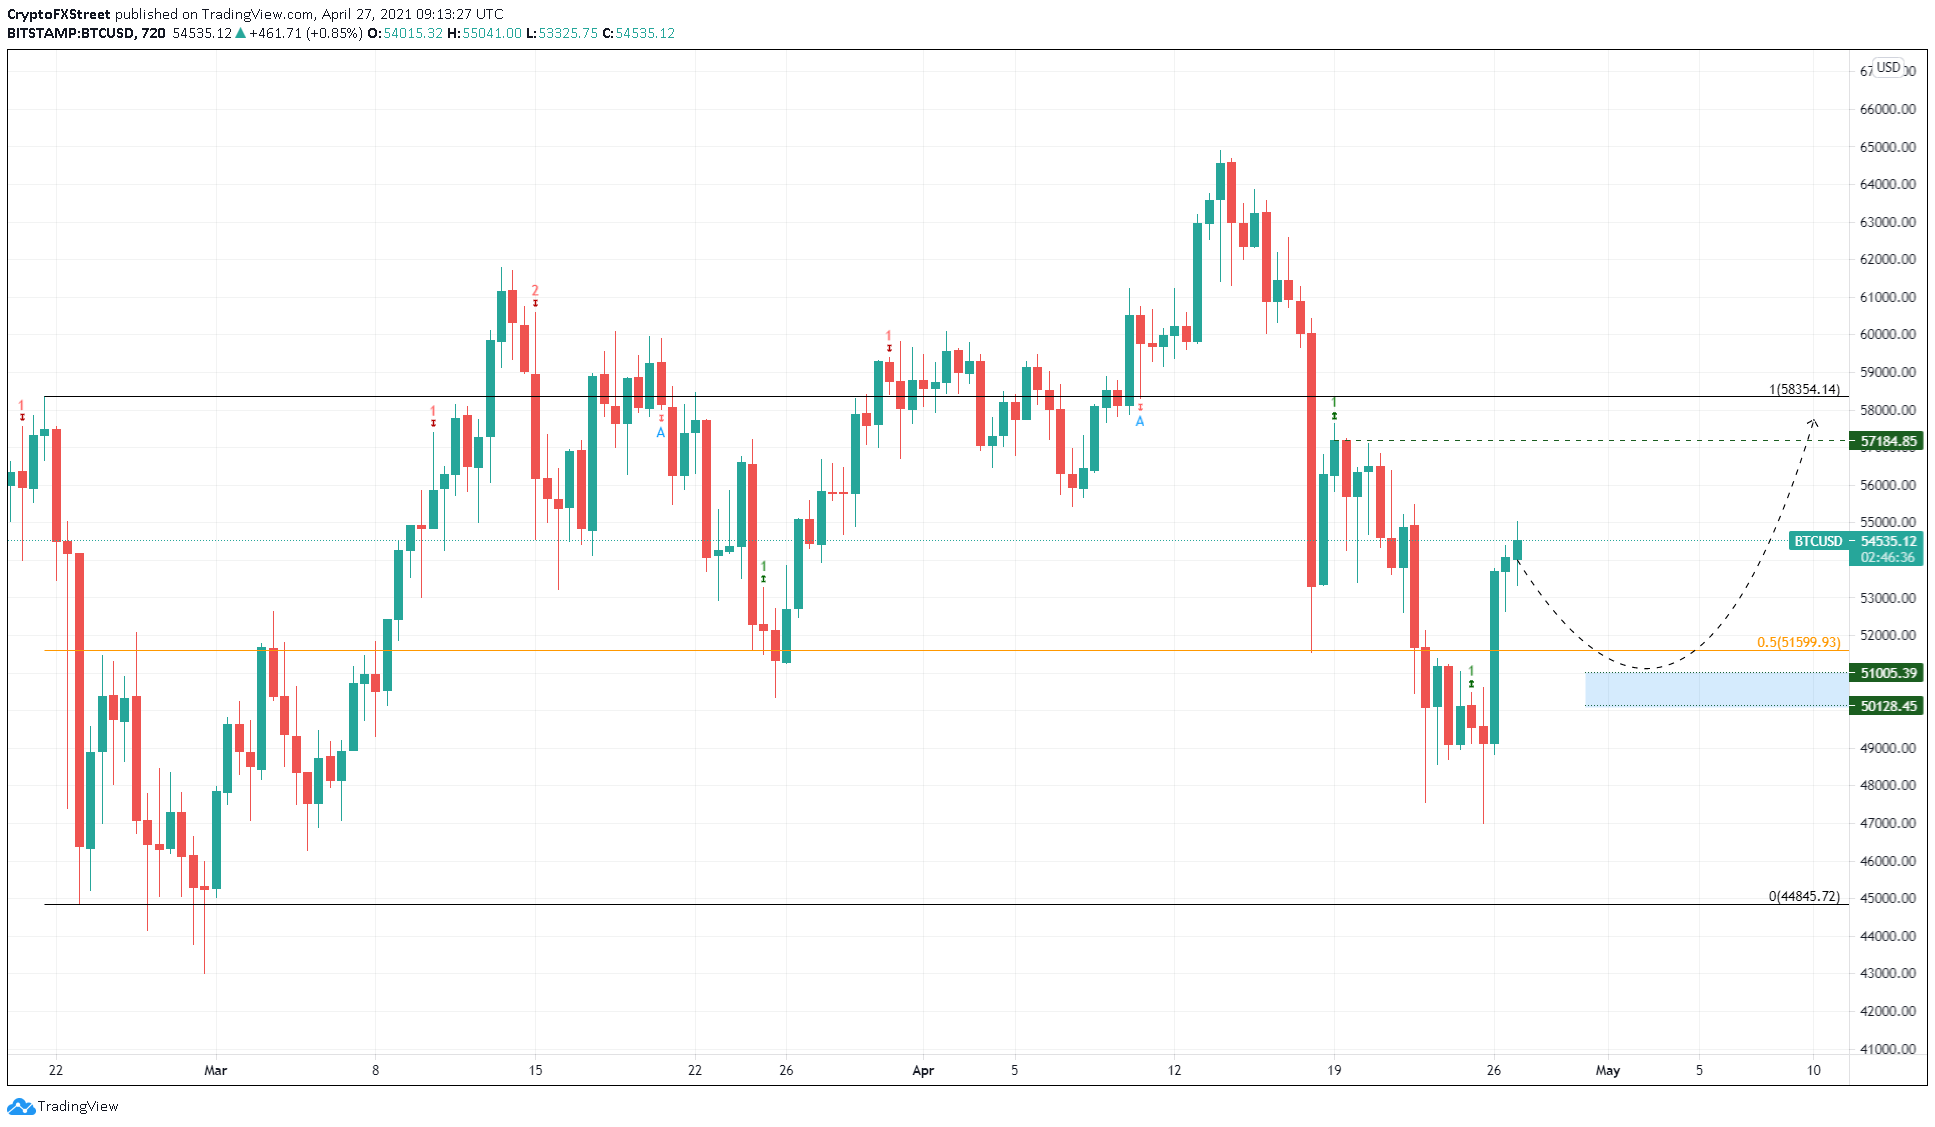
BTC/USD 12-hour chart
The number of Bitcoin tokens held on exchanges has witnessed a continued decline over January 4, albeit a slight upswing in mid-March. Since March 20, BTC held on centralized entities has slumped nearly 7.7%, signifying nearly 150,000 BTC leaving exchanges within this period. This outflow suggests that investors are optimistic about BTC’s bullish potential.
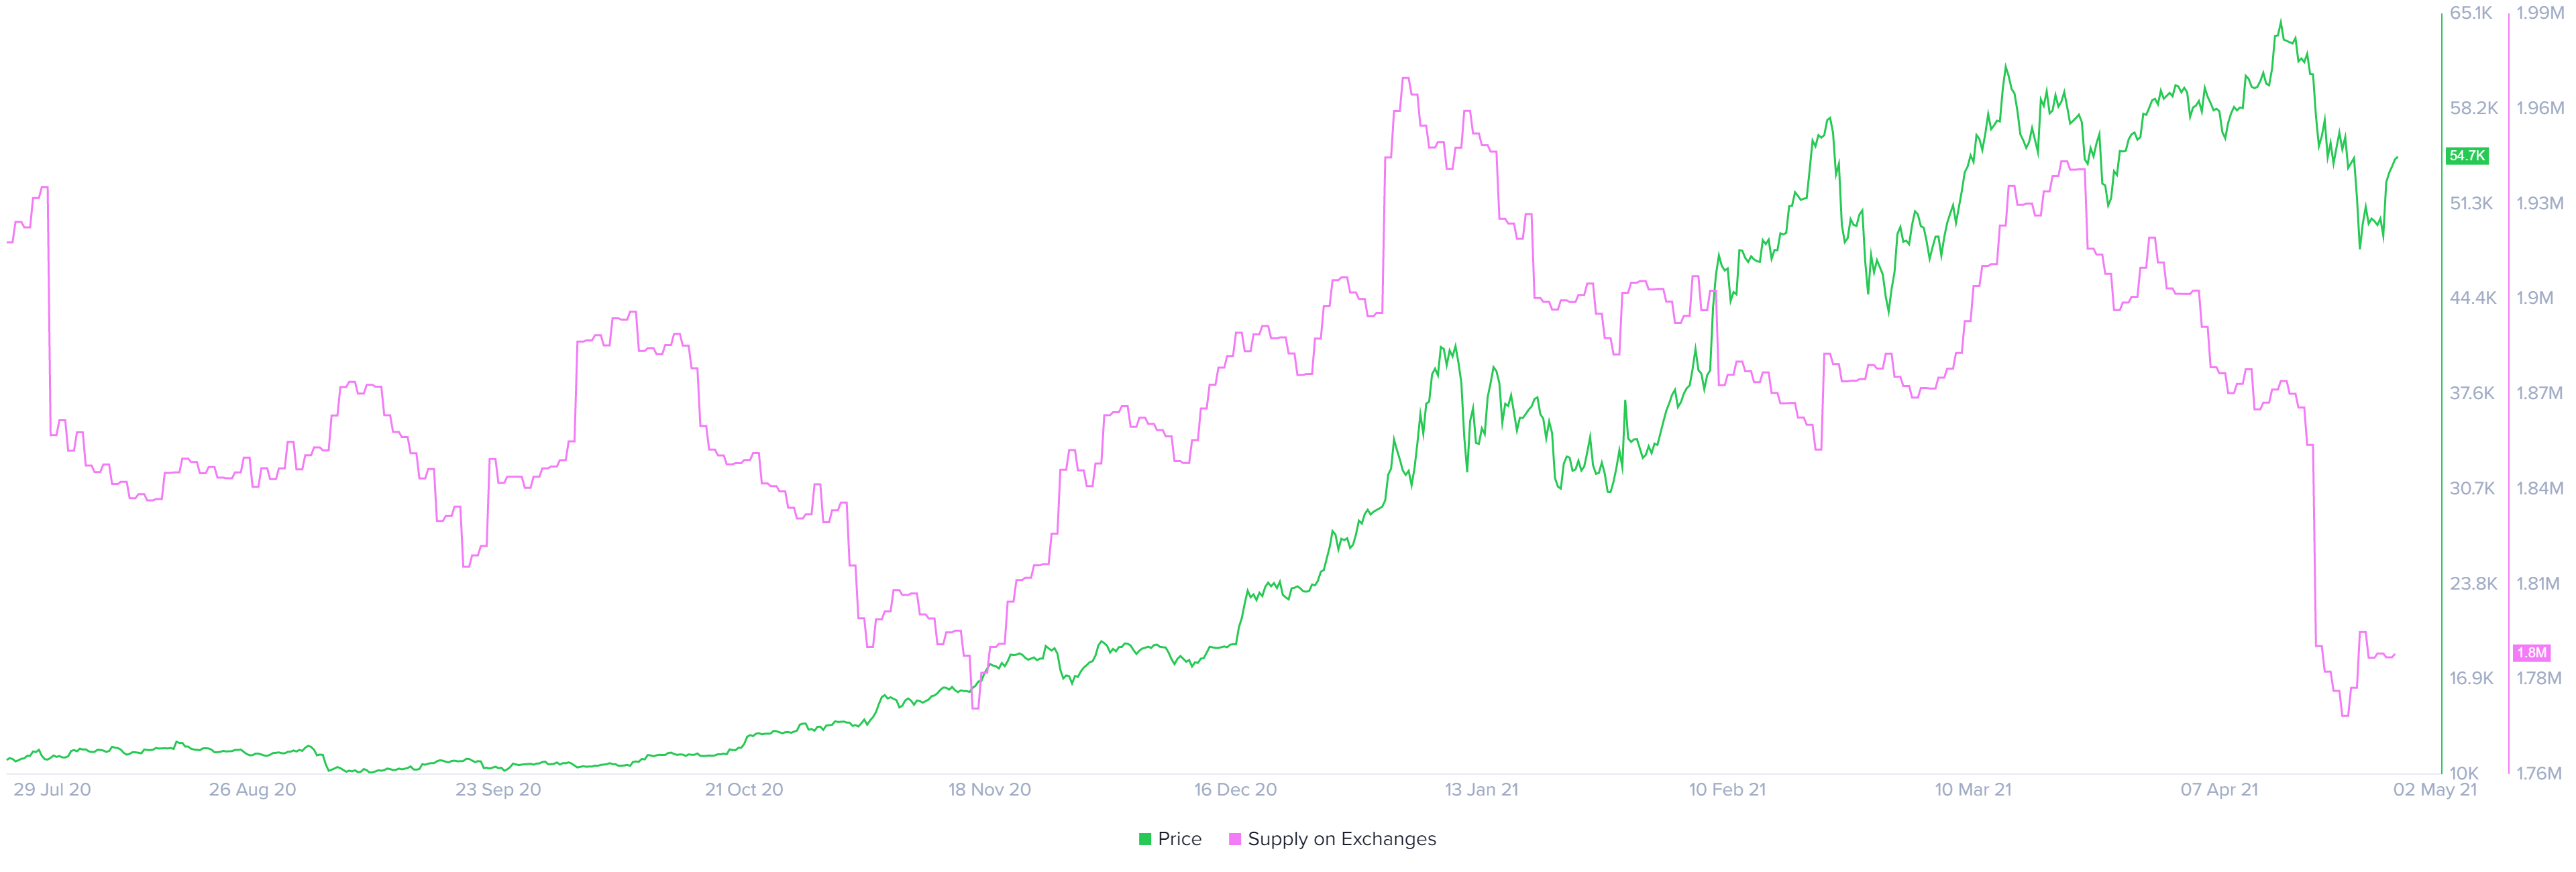
BTC supply on exchanges chart
The average coin dormancy is a metric that tries to paint a picture of the age of the coins being transacted on the Bitcoin network and its importance.
According to Willy Woo,
The coins that were dumped this last week were very young. That’s to say these coins were bought recently and therefore arguably sold by less experienced investors. Typically dips in coin dormancy have signals bottoms.
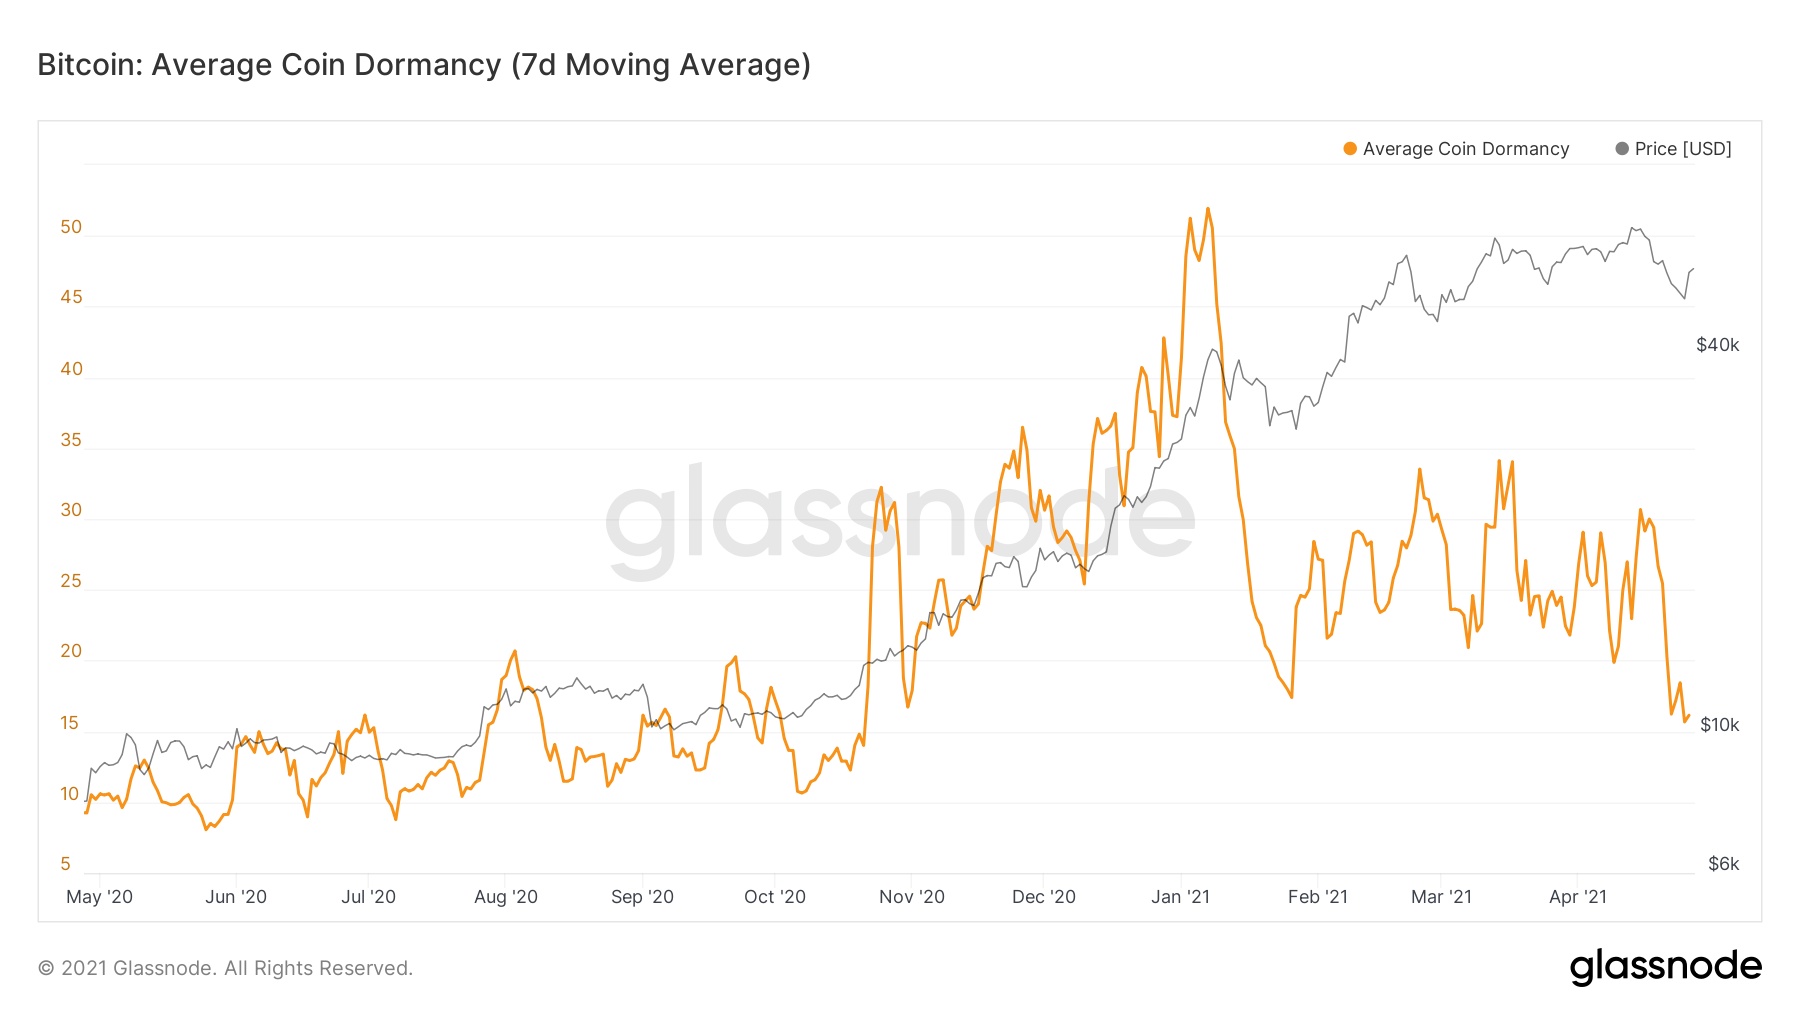
BTC coins in dormancy chart
Santiment’s 30-day MVRV model depicts the network’s average user profit/loss over the past month. Considering this metric dipped down to March 2020 levels, the recent growth to -3.7% from -13.5% suggests that many market participants are scooping up the pioneer crypto at a discount and expecting its market value to increase shortly.
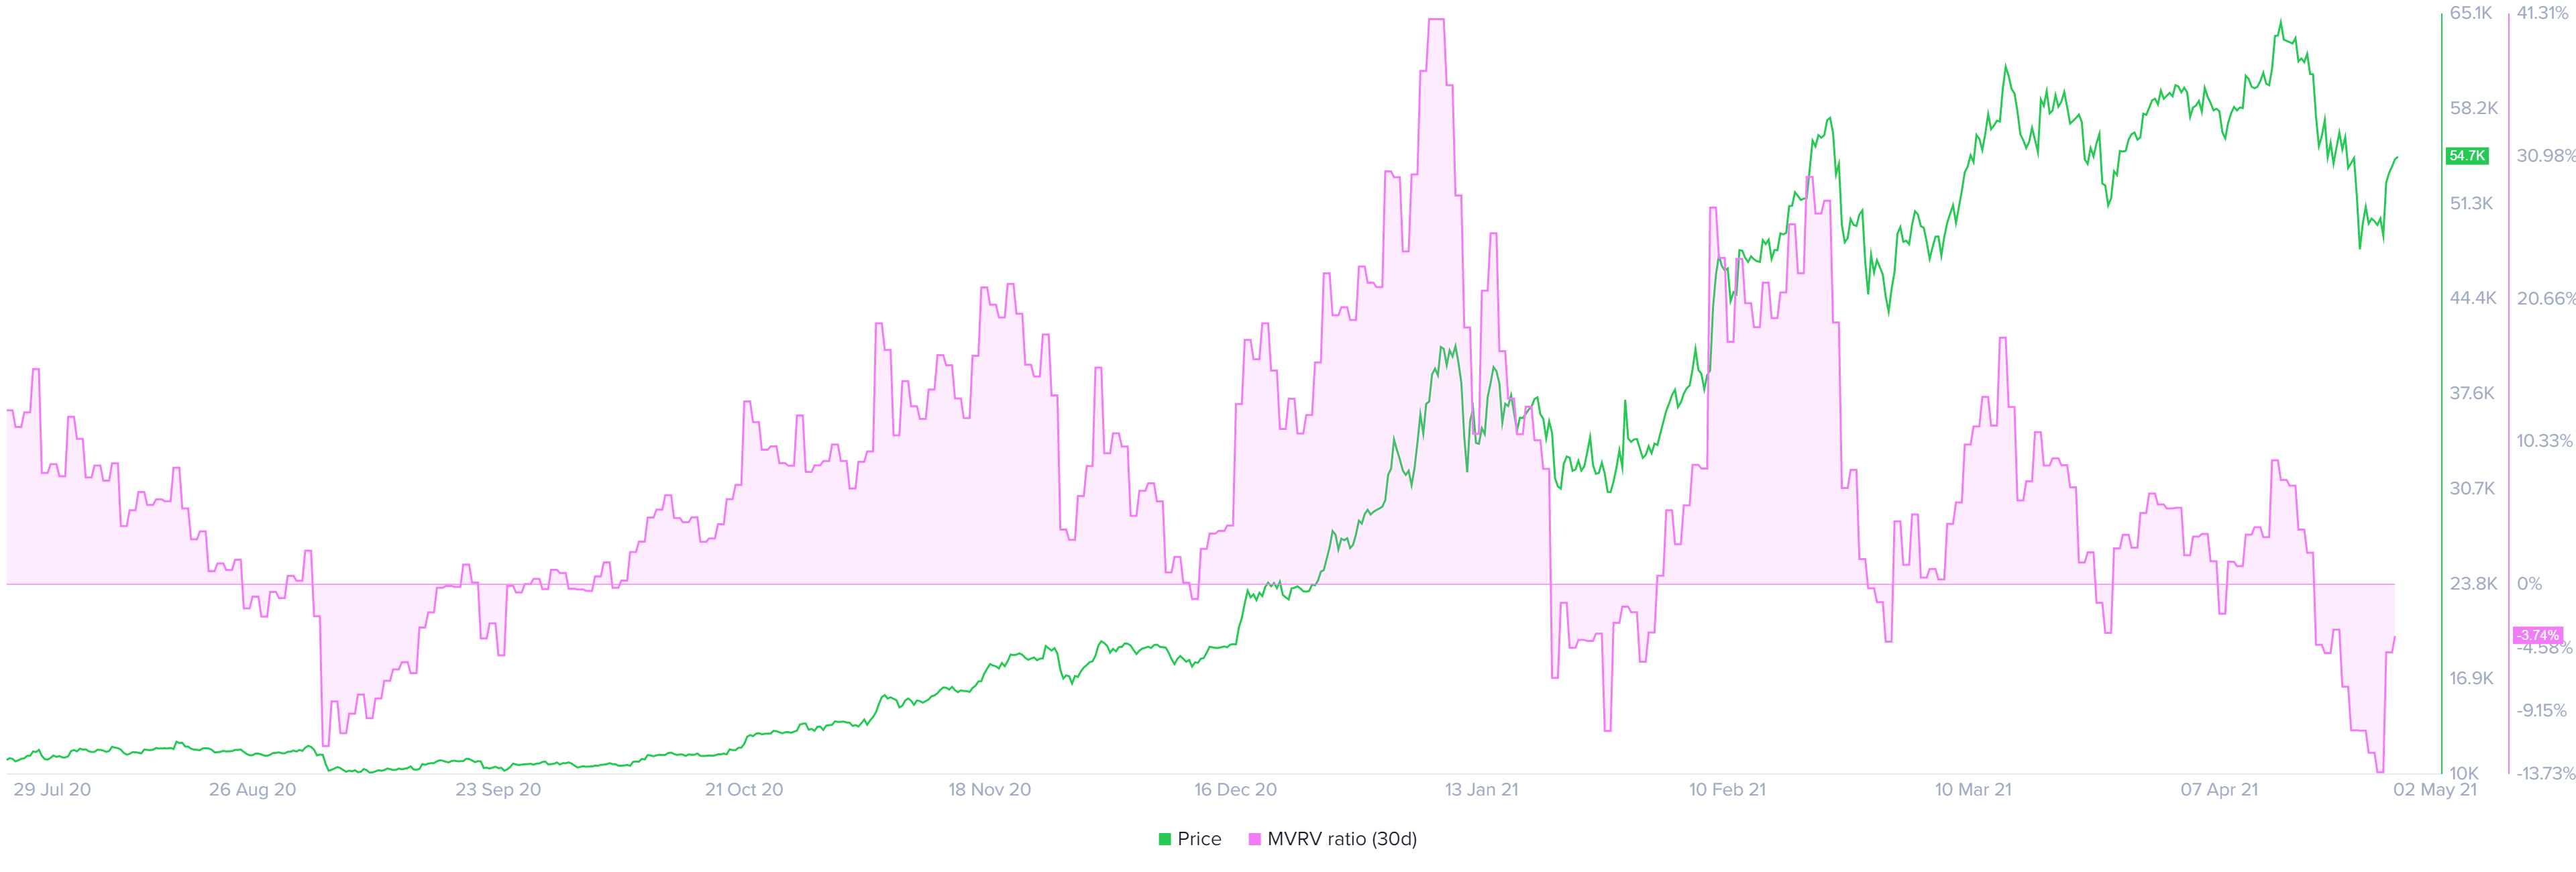
BTC 30-day MVRV chart
To sum it up, Bitcoin price looks bullish from a larger perspective, but potential crashes witnessed over the last couple of days could occur at any moment. Hence, if a similar event comes to pass and pushes BTC below $46,920, it would invalidate the bullish thesis and kick-start a bearish one.
Under such conditions, market participants could see the flagship crypto drop to $44,845.
Author

Akash Girimath
FXStreet
Akash Girimath is a Mechanical Engineer interested in the chaos of the financial markets. Trying to make sense of this convoluted yet fascinating space, he switched his engineering job to become a crypto reporter and analyst.




