Top 3 Price Prediction Bitcoin, Ethereum, Ripple: BTC holds the line, ETH at all-time highs, and XRP rockets
- Bitcoin price steadies along the 100-day simple moving average (SMA) before releasing higher.
- Ethereum price refuses to surrender leadership role with an all-time high.
- Ripple price stabilizes at the psychologically important $1 before catapulting 30%.

The three majors, BTC, ETH, and XRP, played to the technical indicators like maestros, holding essential support at the most crucial moments and proving that technicals have a role in assessing the state and direction of individual cryptocurrencies.
Bitcoin price emphatic as it closes with the best day since February
At Sunday’s low, BTC had lost almost 30% from the April high and closed the week with the second-largest weekly loss since the March meltdown in 2020, the other being in February of this year. The low harmonized with the junction of the March 25 low at $50,305 and the 100-day SMA at $49,500. In parallel, the force of the sell-off drove the flagship cryptocurrency to the most oversold reading on the daily Relative Strength Index (RSI) since the March 2020 low. Hence, resetting it to pursue fresh highs and shaking off the bearish momentum divergence that cast a shadow since February.
Before getting too fuzzy, BTC faces hurdles on the path to new highs, such as the 10-week SMA at $54,682 and the 50-day SMA at $56,982. The lower trend line of the rising wedge at $61,870 and, of course, the 361.8% Fibonacci extension of the 2017-2018 bear market at $63,777. To conquer the multitude of resistance levels, the bellwether cryptocurrency will need to command better volume than yesterday.
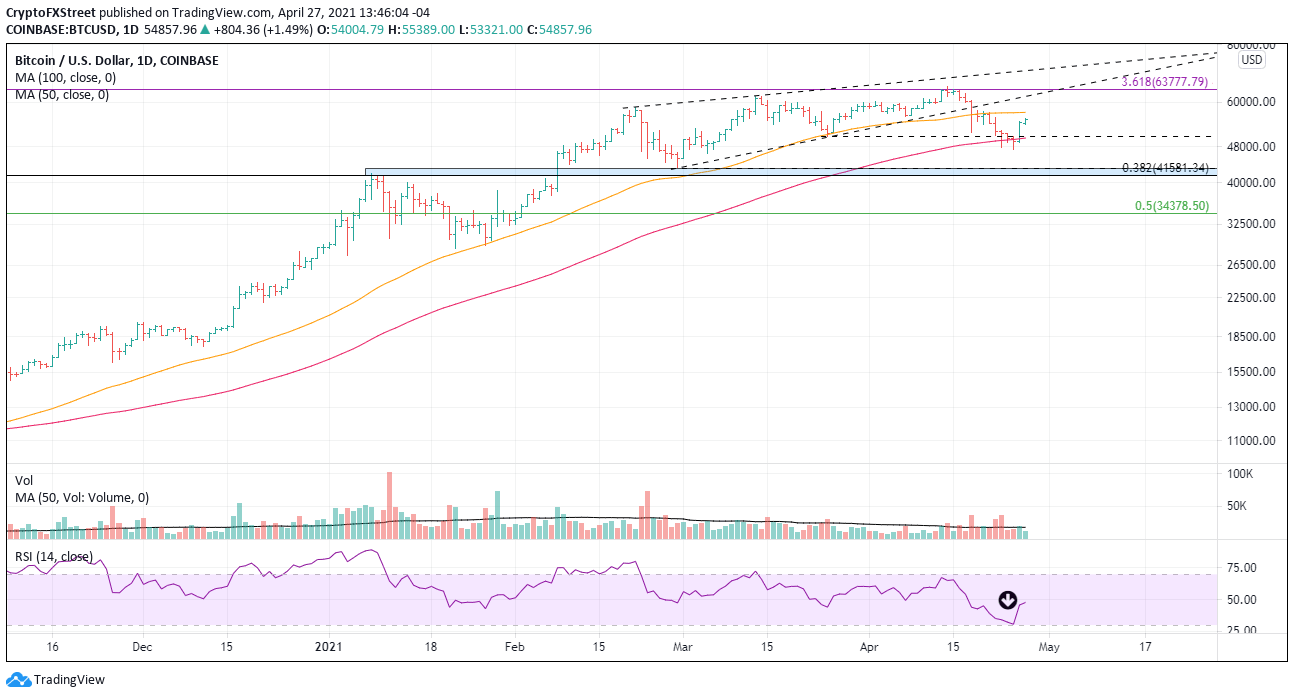
BTC/USD daily chart
Was it a dead-cat bounce? A natural question and relevant in the coming days, particularly if a continuation of the rally stalls around the current price. A failure to ignite has to prompt speculators to define the intersection of the March 25 low and the 100-day SMA as critical support. Any failure at that level exposes BTC to a quick decline to the convergence of the February low at $43,016 with the January high at $41,986 and the 38% retracement of the rally since the March 2020 low at $41,581.
Ethereum price strength affirms leadership intentions
Since the end of March, ETH has not closed one week with a loss. A noteworthy technical achievement considering the magnitude of the losses incurred by most of the altcoins. In fact, the smart contracts token has a printed an all-time high each week during that time.
Moving forward, ETH has no resistance of note until the confluence of the 161.8% extension of the March 22-23 sell-off at $3,008 with the psychologically important $3,000. Considerable resistance emerges at the cluster of 261.8% extensions related to the 2018 bear market, the February crash, the March decline, and the April decline. The range is from $3,252 to $3,587.
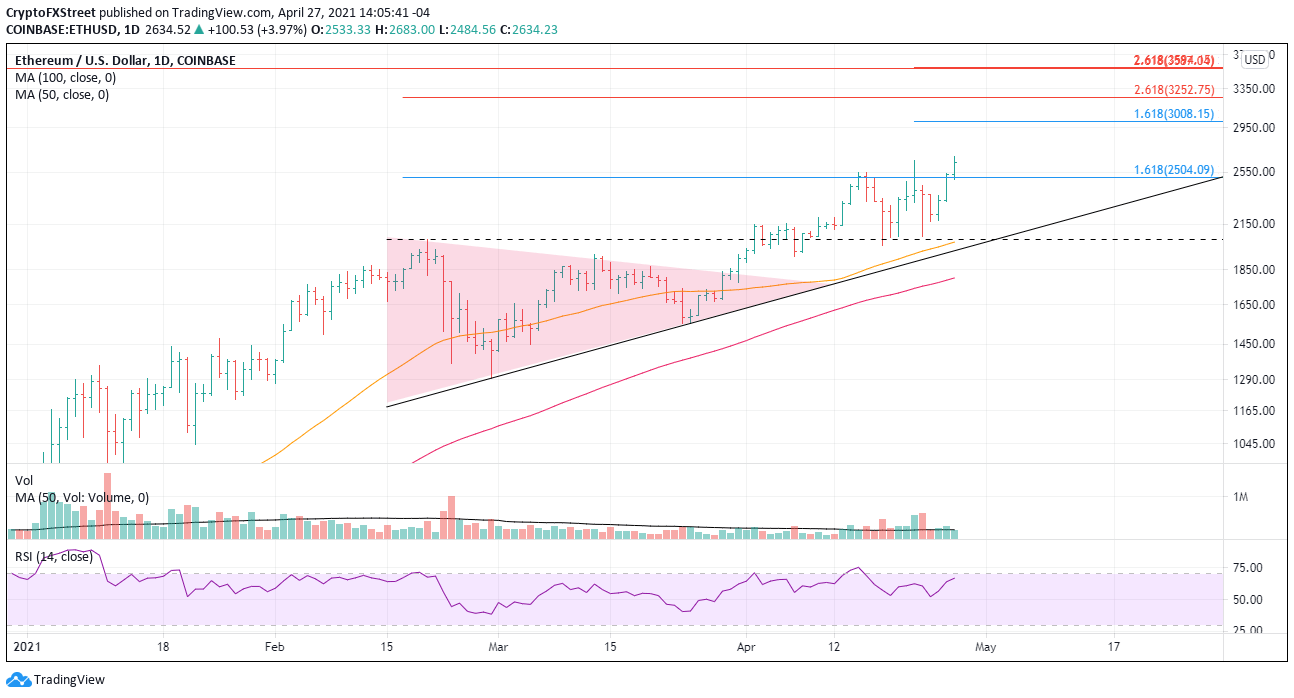
ETH/USD daily chart
No doubt ETH could throw a curveball and flip from relative strength leader to the ugly stepchild. Support begins at $2,504 and then falls to $2,041, followed by the 50-day SMA at $2,026 and the rising trendline at $1,960.
Lastly, take note that ETH is printing new highs without the daily RSI printing new highs. A bearish momentum divergence to watch.
Ripple price gain casts shade over most of the cryptocurrency complex
Last week XRP closed down 26.41%, the largest weekly loss since the SEC charged crash in December 2020 of 49%. It yielded a total decline of 55% for the international settlements token from the April high.
XRP responded with a 30% gain yesterday, but today’s follow-through has faded quickly at the 50% retracement of the April decline. More resistance can be expected at the 61.8% retracement at $1.55 and the 78.6% retracement at $1.73.
The prominent levels in the crosshairs are $2.00 and the 61.8% retracement of the 2018-2020 bear market at $2.08.
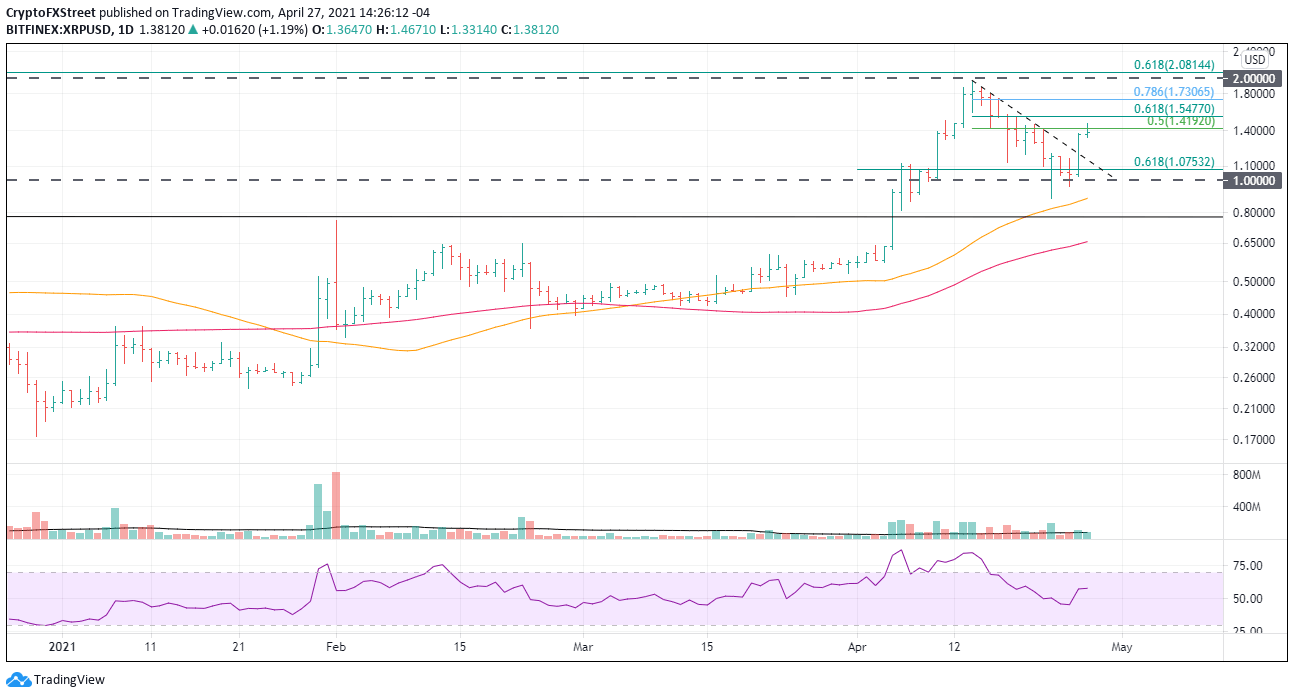
XRP/USD daily chart
The path for Ripple is more complicated than most cryptocurrencies at the moment, with the overhang of the SEC case against key executives headlining media reports regularly. A positive outlook will remain the best approach unless the descending trendline from the April high at $1.15 fails. After that, the big $1 is the final arbitrator over whether XRP heads to $0.80 or not.
Author

Sheldon McIntyre, CMT
Independent Analyst
Sheldon has 24 years of investment experience holding various positions in companies based in the United States and Chile. His core competencies include BRIC and G-10 equity markets, swing and position trading and technical analysis.




