Top 3 Price Prediction Bitcoin, Ethereum, Ripple: BTC displays signs of life, altcoins come out of woodwork
- Bitcoin price has reacted positively after dipping into the demand zone, extending from $30,573 to $31,979.
- A continuation of this uptrend will likely propel BTC by 11% to the 50% Fibonacci retracement level at $35,618.
- If the $30,000 support level is shattered, the bullish thesis will face invalidation.

Bitcoin price has been consolidating below the midpoint of the range for nearly two weeks. Despite multiple failed attempts, the recent dip into the demand zone suggests that it might take another jab at shattering it.
If this were to happen, Ethereum, Ripple and other altcoins would likely follow suit.
Bitcoin price reversal in play
Bitcoin price failed to slice through the 50% Fibonacci retracement level at $35,618 twice over the past two weeks. The resulting downswing has pushed BTC toward a demand zone ranging from $30,573 to $31,979.
A dip into this area of buy orders will likely lead to an uptrend. The immediate barrier that will hinder a move higher is the midpoint at $35,618. Therefore, producing a decisive 6-hour candlestick close above this level will indicate a resurgence of bullish momentum.
In such a case, BTC might test the $36,600 and $39,146 resistance levels. If the bid orders continue to pile up, Bitcoin price might hit $40,000.
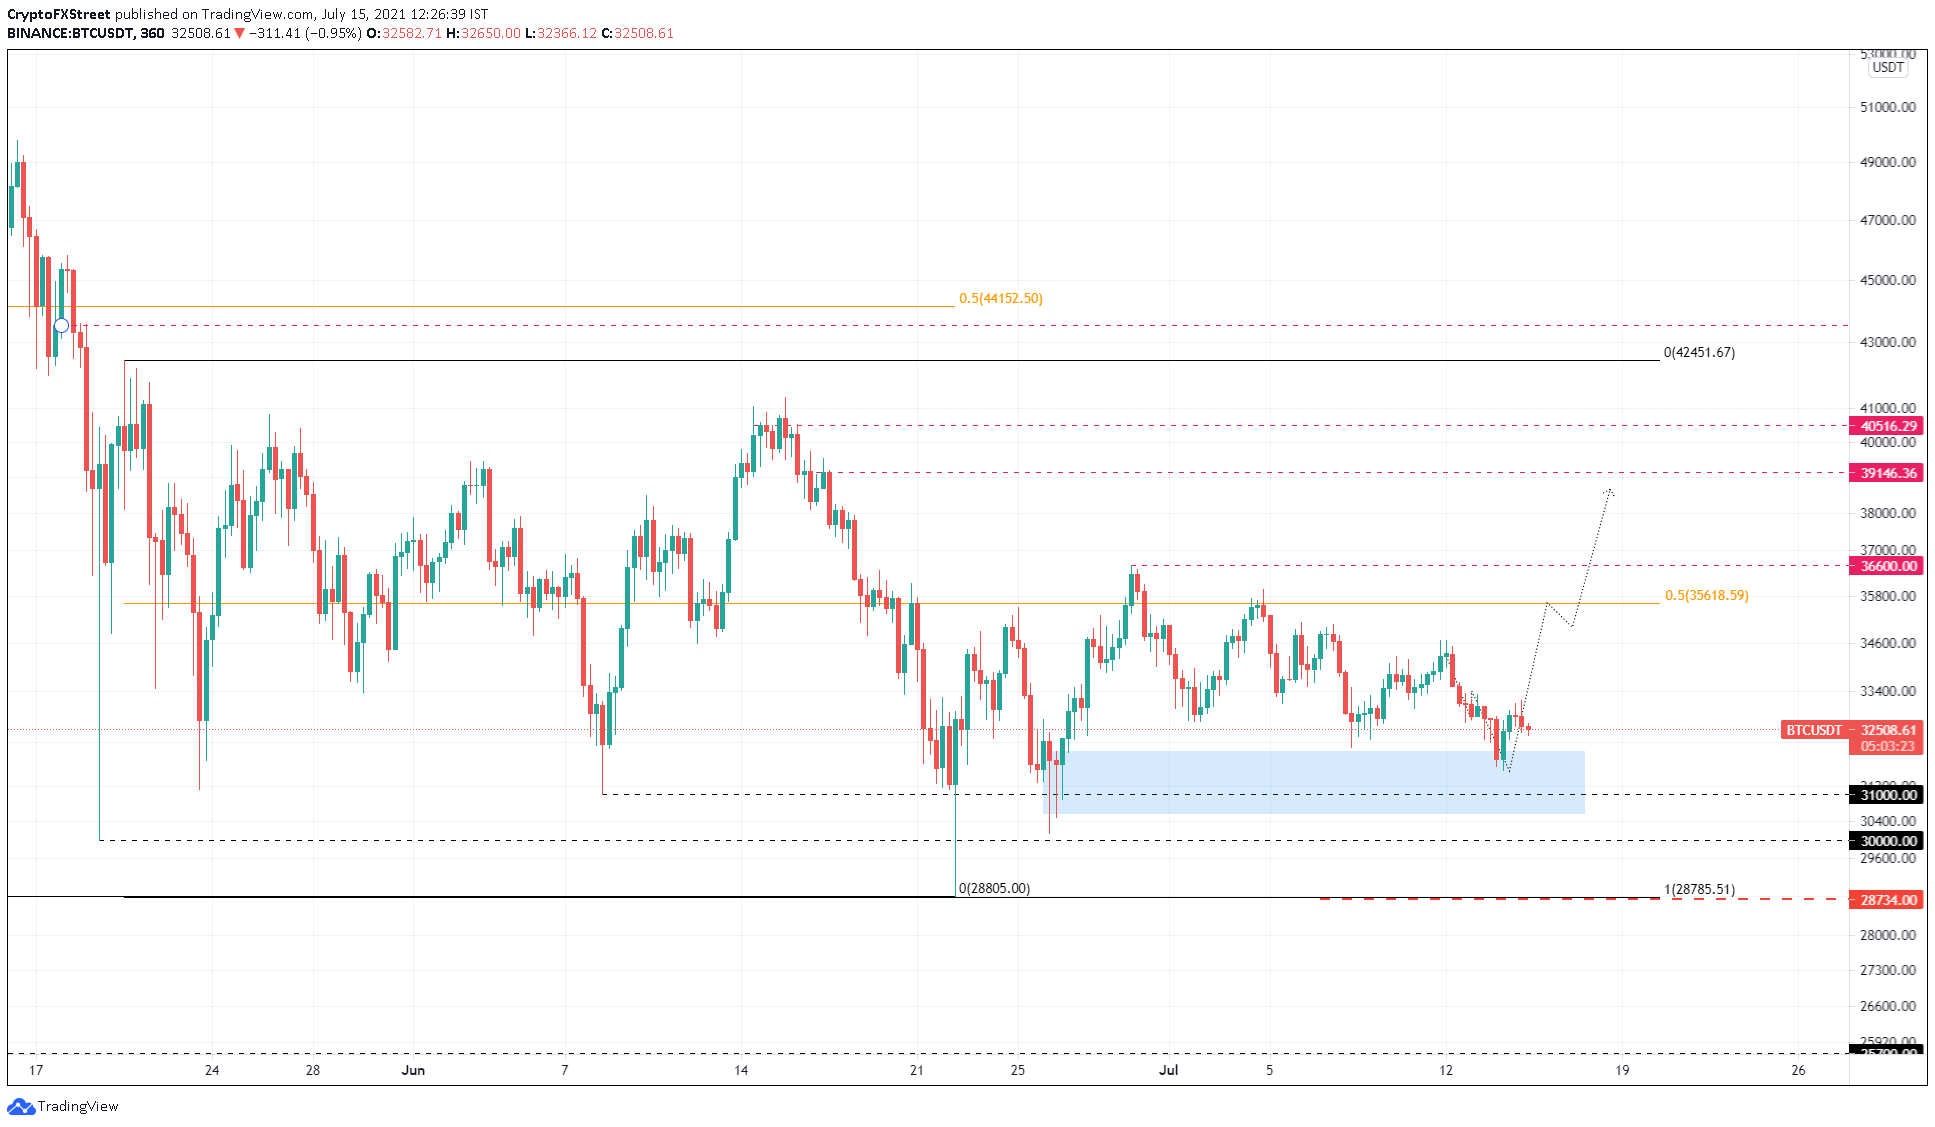
BTC/USDT 6-hour chart
While things are turning bullish for Bitcoin price, investors need to be aware of a potential spike in selling pressure that shatters the demand zone’s lower level at $30,573. If this were to occur, it would denote weakness among buyers.
This move will lead to a retest of the $30,000 support level, a breakdown of which will invalidate the bullish outlook.
Ethereum price kick-starts its move higher
Ethereum price has completed its downside target after breaking out of a rising wedge pattern on July 8. Moreover, ETH appears to have bottomed out around $1,869 and shows that a full-blown reversal is on its way.
Adding tailwinds to this thesis is Bitcoin price’s bullish reaction seen around a crucial demand zone, which suggests that an uptrend is in the works. If this were to happen, Ethereum would follow BTC’s lead and head higher.
The first major resistance that ETH will face is $2,018. Breaching this level will put the altcoin face to face with a recently flipped supply zone ranging from $2,041 to $2,106. If the bulls produce a decisive 6-hour candlestick close above this level, it will signify that the buyers are back.
Such a move will open the path for Ethereum price to retest the trading range’s midpoint at $2,297. This run-up from $1,956 to $2,297 would constitute a 17% ascent.
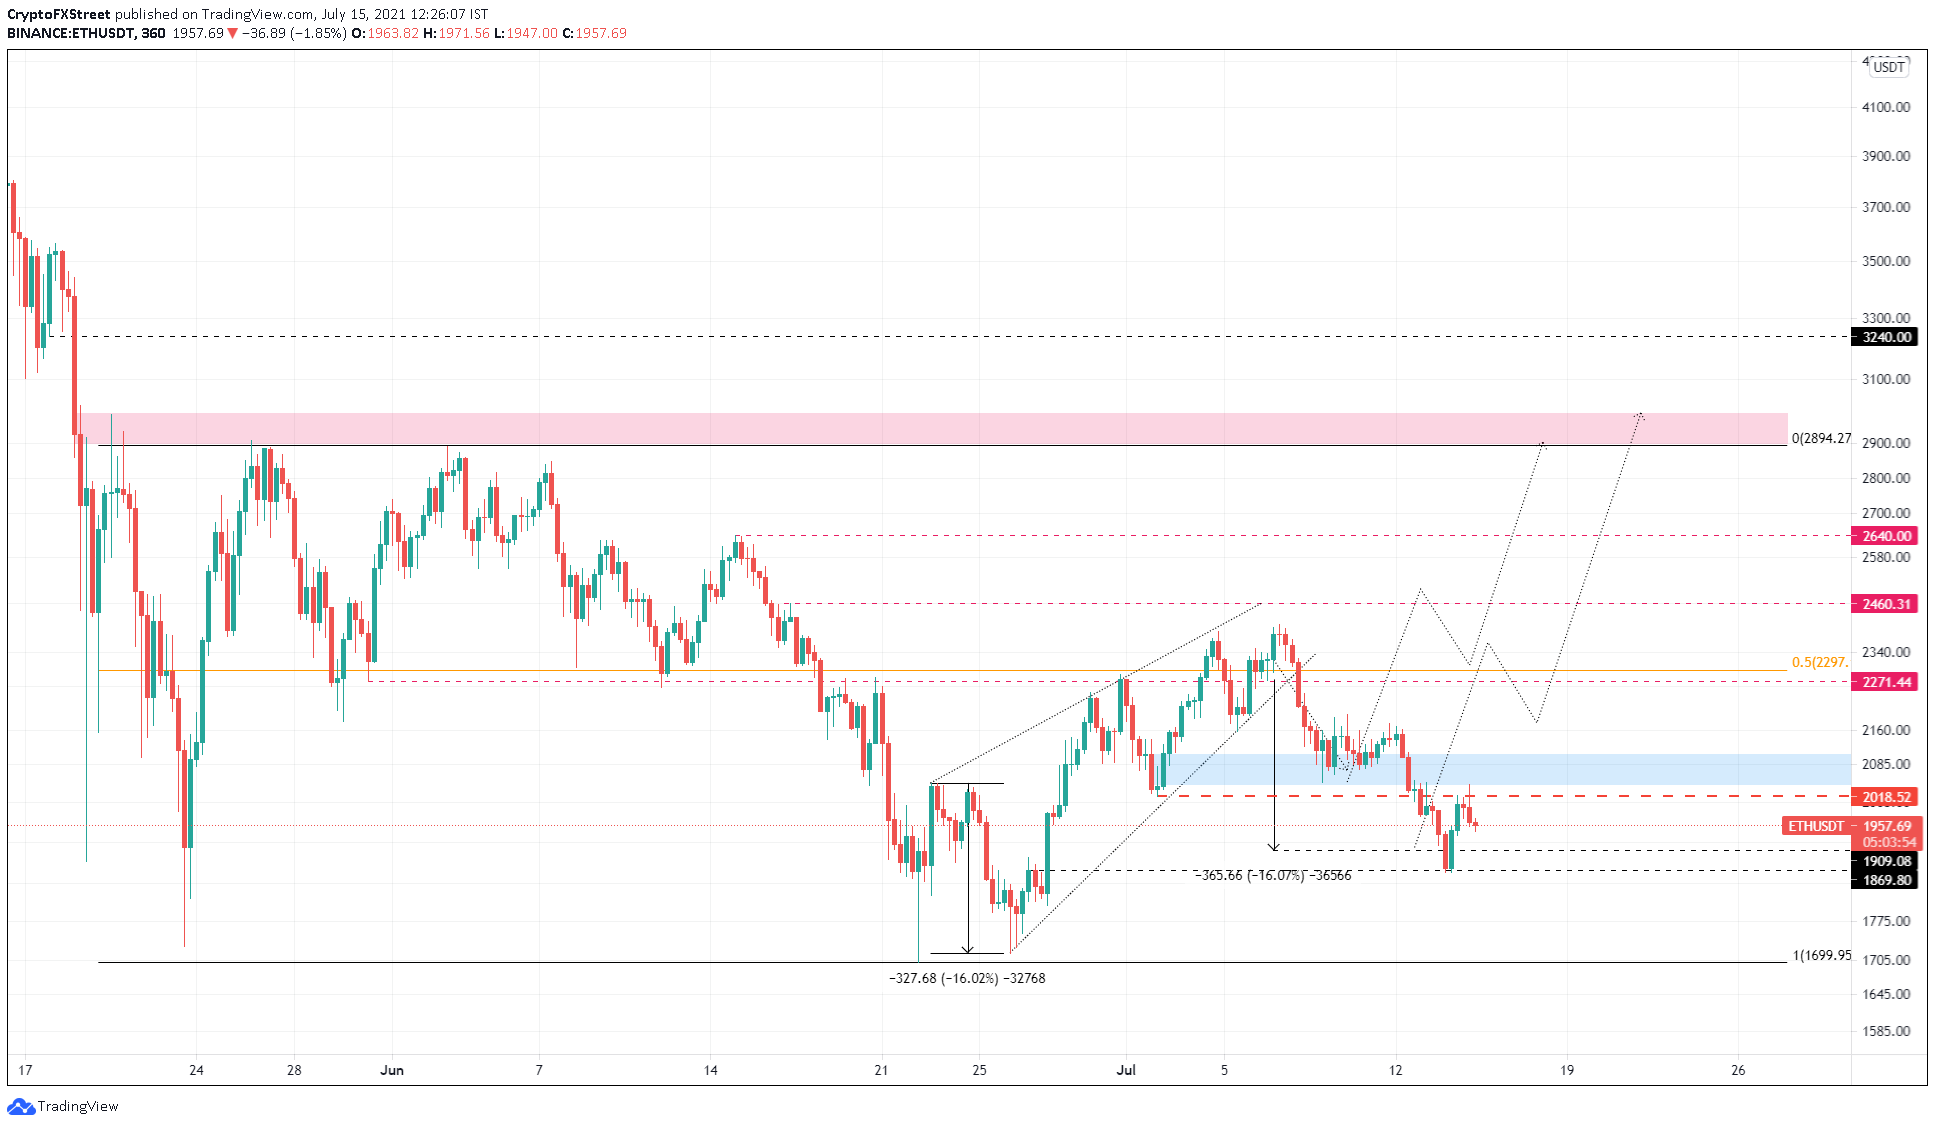
ETH/USDT 6-hour chart
On the other hand, a breakdown of the $1,869 support level will indicate the bullish momentum is lacking. This move will open the path for a sell-off to the range low at $1,700.
A breakdown of this barrier will invalidate the bullish outlook and potentially trigger a move to $1,438.
Ripple price prepares for a burst of bullish momentum
Ripple price set up a second swing low at $0.585 on July 14, signaling the start of a potential uptrend. If the buying pressure continues to hold, XRP will likely tag the 50% Fibonacci retracement level at $0.647.
A decisive 4-hour candlestick close above this barrier will indicate a resurgence of buying pressure. Such a move will open up the path for XRP to take another jab at piercing the high probability reversal zone, which extends from $0.68 to $0.727.
The bullish momentum could face a slowdown after a 16% rally to $0.704. However, if it does not, investors can expect the remittance token to shatter $0.727 and take a jab at the range high at $0.785.
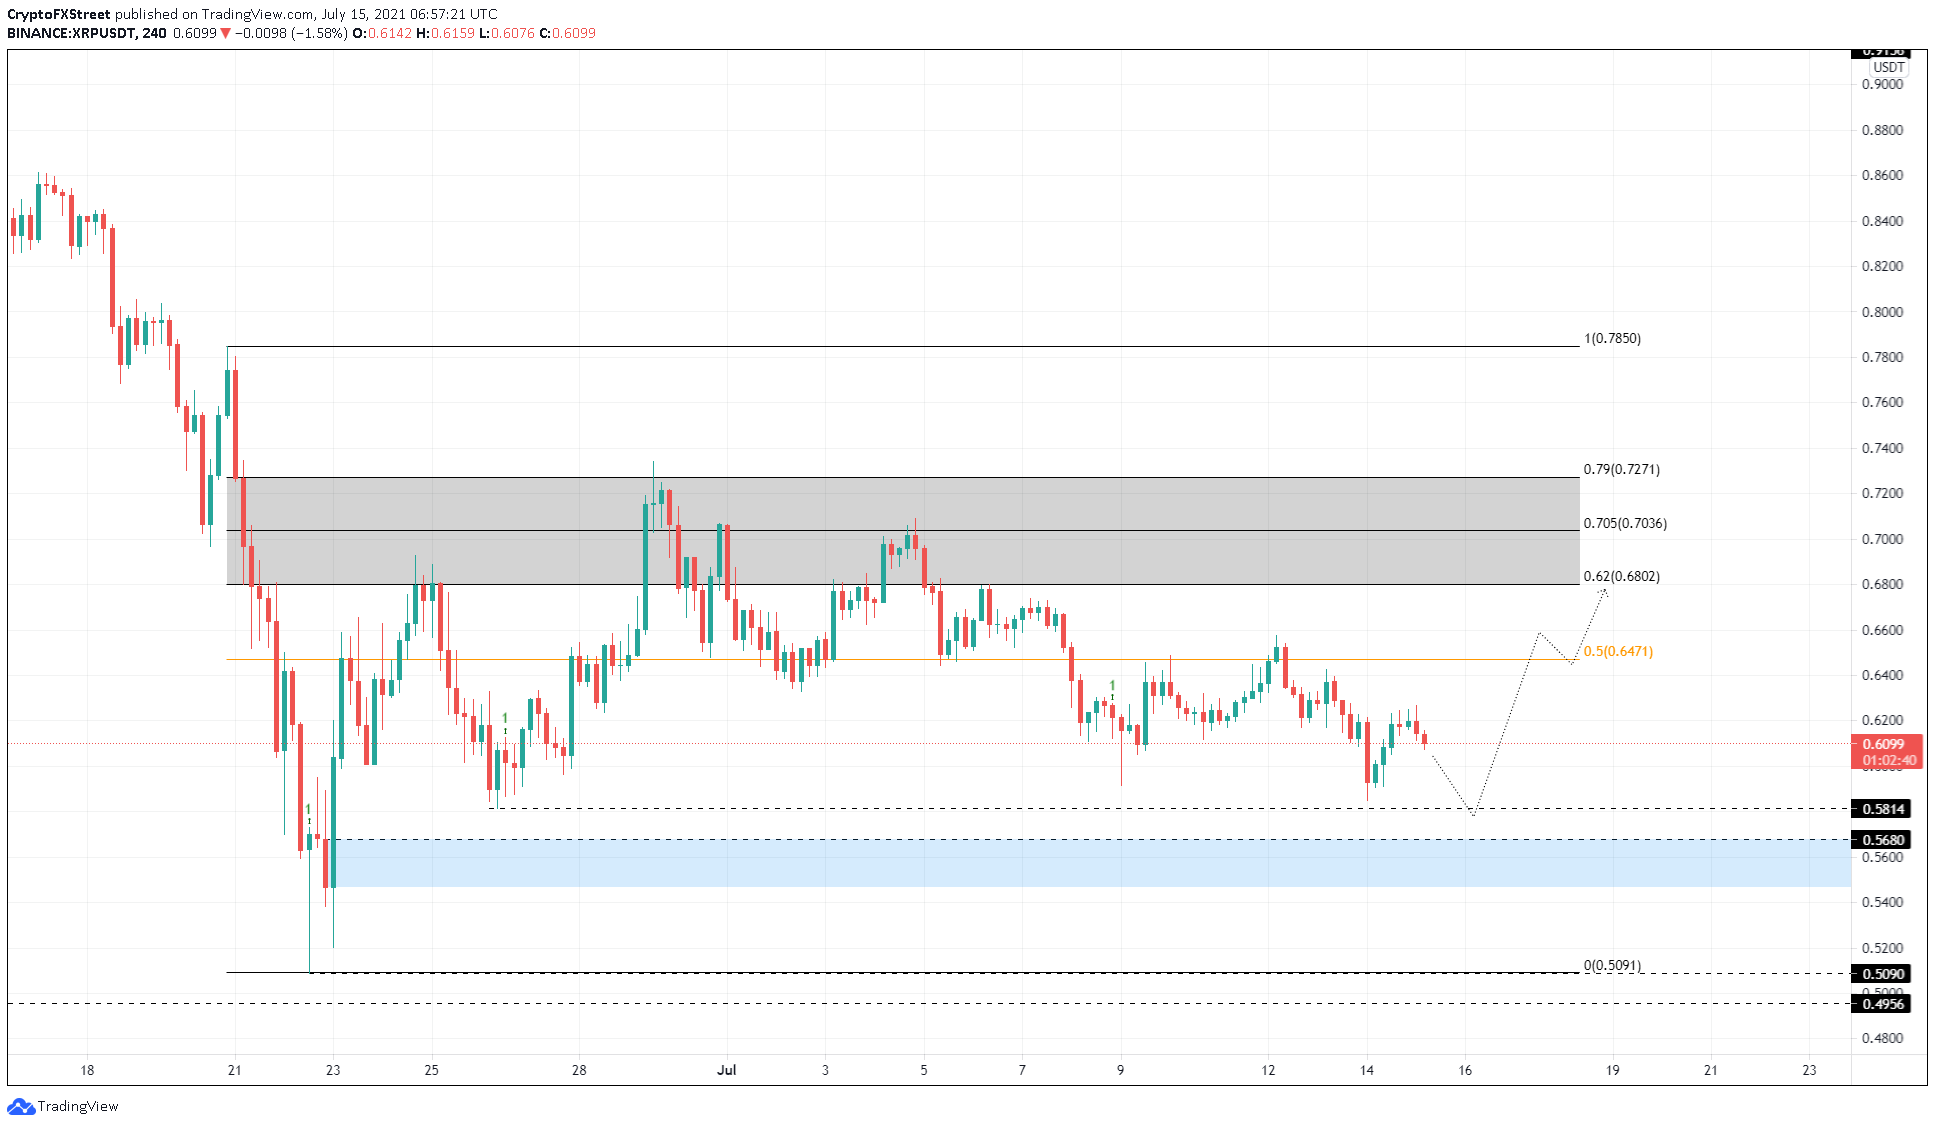
XRP/USDT 4-hour chart
If the buying pressure fails to climb past the 50% Fibonacci retracement level at $0.647, it will indicate that the bulls are weak. While such a development could hinder or delay the uptrend, a breakdown of the demand zone’s lower limit at $0.547 will invalidate the bullish outlook.
In such a case, XRP price might retest the range low at $0.509.
Author

Akash Girimath
FXStreet
Akash Girimath is a Mechanical Engineer interested in the chaos of the financial markets. Trying to make sense of this convoluted yet fascinating space, he switched his engineering job to become a crypto reporter and analyst.



