Top 3 Price Prediction Bitcoin, Ethereum, Ripple: An inverted chart reveals BTC price intentions
- Bitcoin price down -7% this week, but the flagship cryptocurrency is discovering support at the 50-week simple moving average (SMA).
- Ethereum price is down -11% this week, falling below the support designated by the 2020 ascending trend line.
- XRP price down -6% for the week, but approaching support framed by the 78.6% Fibonacci retracement.

Bitcoin price remains the guidepost for cryptocurrency market interpretations and forecasts. Still, there may be some clarity emerging about BTC intentions and, as a result, the direction of all altcoins, including Ethereum and Ripple.
Bitcoin price exposes its secret
Take a look at the chart below. Is the pattern bullish, bearish or neutral? Would you buy, sell or hold?
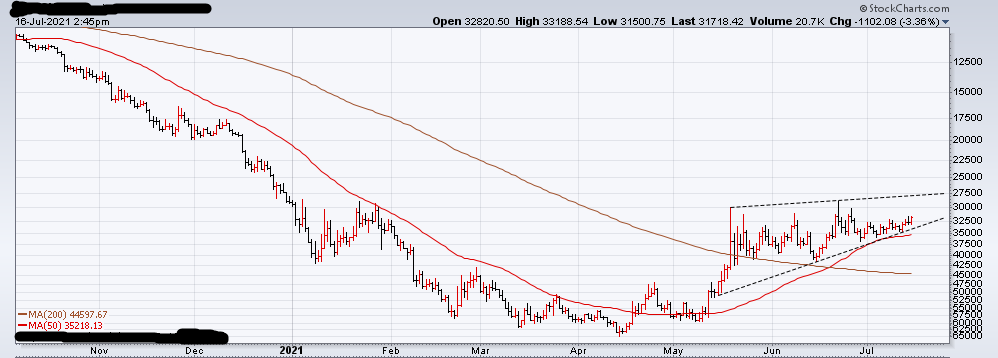
The pattern represented in the chart above is a rising wedge with two touches on the upper trend line and three on the bottom trend line. The rising wedge continues the original rally off the April low, and the 50-day SMA supports the lower trend line. However, is it a bullish scenario?
Rising wedge patterns are generally categorized as bearish, whether they are a reversal or continuation type. In this case, the rising wedge is a reversal type as it slopes up with the prevailing trend, indicating that the final price direction will be down—a bearish outcome.
Interestingly, the above chart is Bitcoin price inverted, offering a perspective that most market operators are not accustomed to analyzing. Thus, the bearish interpretation of the above chart is bullish when considered from the non-inverted version or standard chart. It is a falling wedge that is deemed bullish, either as a reversal or continuation type.
A standard chart is below, and the price structure is much clearer after considering the inverted version. Bitcoin price could slip lower and print a new correction low around $27,800 before rallying higher. The other alternative is for BTC to rally immediately, taking out the wedge’s upper trend line, besting the 50-day SMA at $35,093 and marching to the exceptional resistance around the 38.2% Fibonacci retracement level of the April-June correction at $42,589. A test of the Fibonacci level would generate a 30% return from the current Bitcoin price.
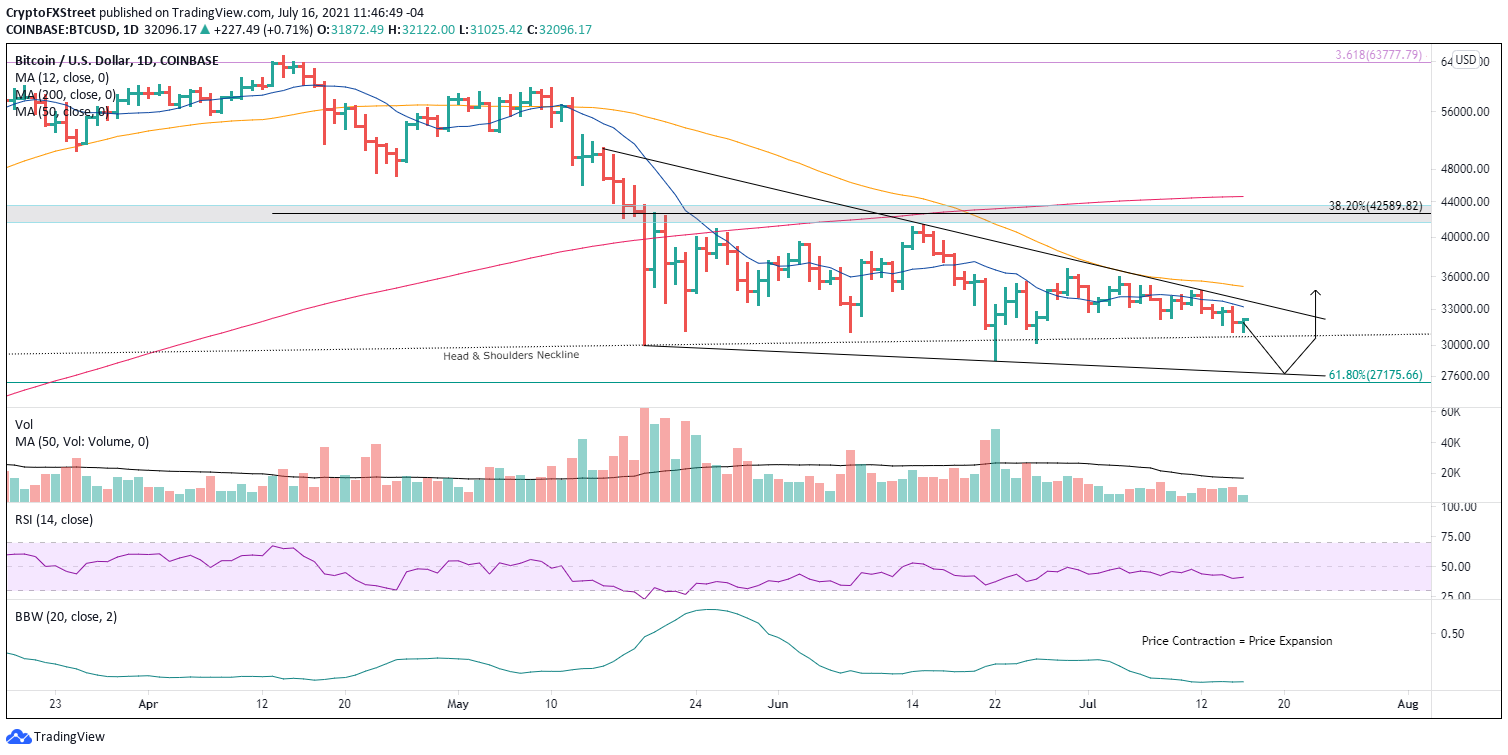
BTC/USD daily chart
With the BTC 50-week SMA at $31,880 and the 12-month SMA at $32,027 currently providing support, the odds favor an immediate upward resolution of the falling wedge. Moreover, the tightening of Bitcoin price over the last few weeks, highlighted by the Bollinger Band Width (BBW) on the daily chart, points to an impulsive release from the formation.
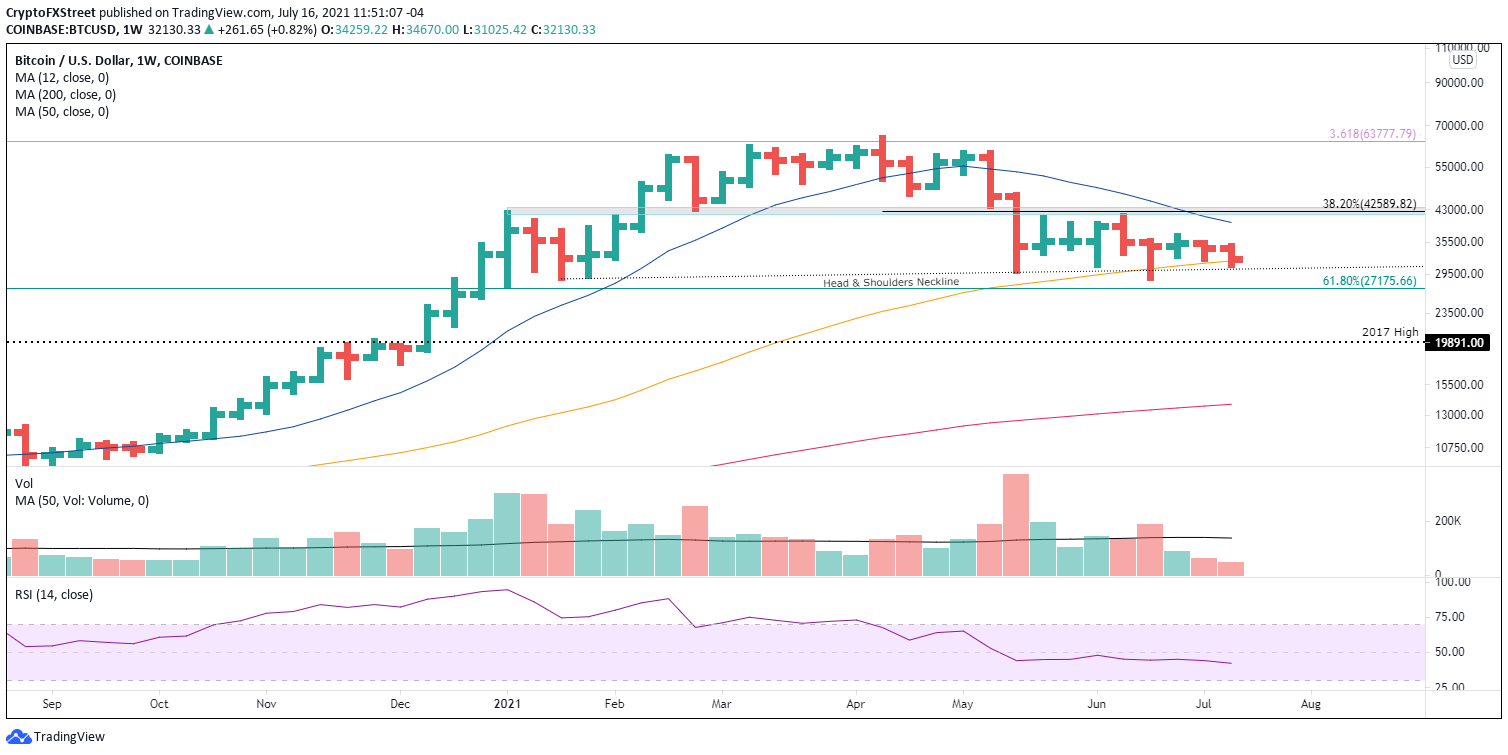
BTC/USD weekly chart
With the creativity of an inverted chart, the interpretation of the Bitcoin price structure becomes easier.
Here, FXStreet's analysts evaluate where BTC could be heading next as it seems bound for a rebound before capitulation.
Ethereum price hanging out in no man’s land
On July 13, Ethereum price convincingly broke the support constructed by the confluence of the crucial February high of $2,041 with the 200-day SMA at $2,036 and the 2020 ascending trend line at $1,984. The daily close below the trifecta of support was an inflection point for ETH and raised the probability of a deeper, more volatile decline.
Ethereum price remains below the trifecta of support, discouraging a meaningful rebound from the current price level. The potential downside includes the 61.8% Fibonacci retracement of the 2020-2021 advance at $1,730, the June 22 low of $1,700 and the 2018 high of $1,419. A move to the 2018 high would represent a loss of 26% from the current price.
However, ETH investors need to recognize the potential for a bear trap. More specifically, Ethereum price temporarily drops below the 2020 ascending trend line, creating fear before rapidly recovering the trifecta of resistance in a sling-shot formation. The potential for this scenario is supported by the emerging bullish outlook for Bitcoin price.
ETH upside potential includes the 50-day SMA at $2,276 and the upper trend line of the larger descending triangle pattern (in blue) at $2,533, presenting a rally of 30% from the current price.
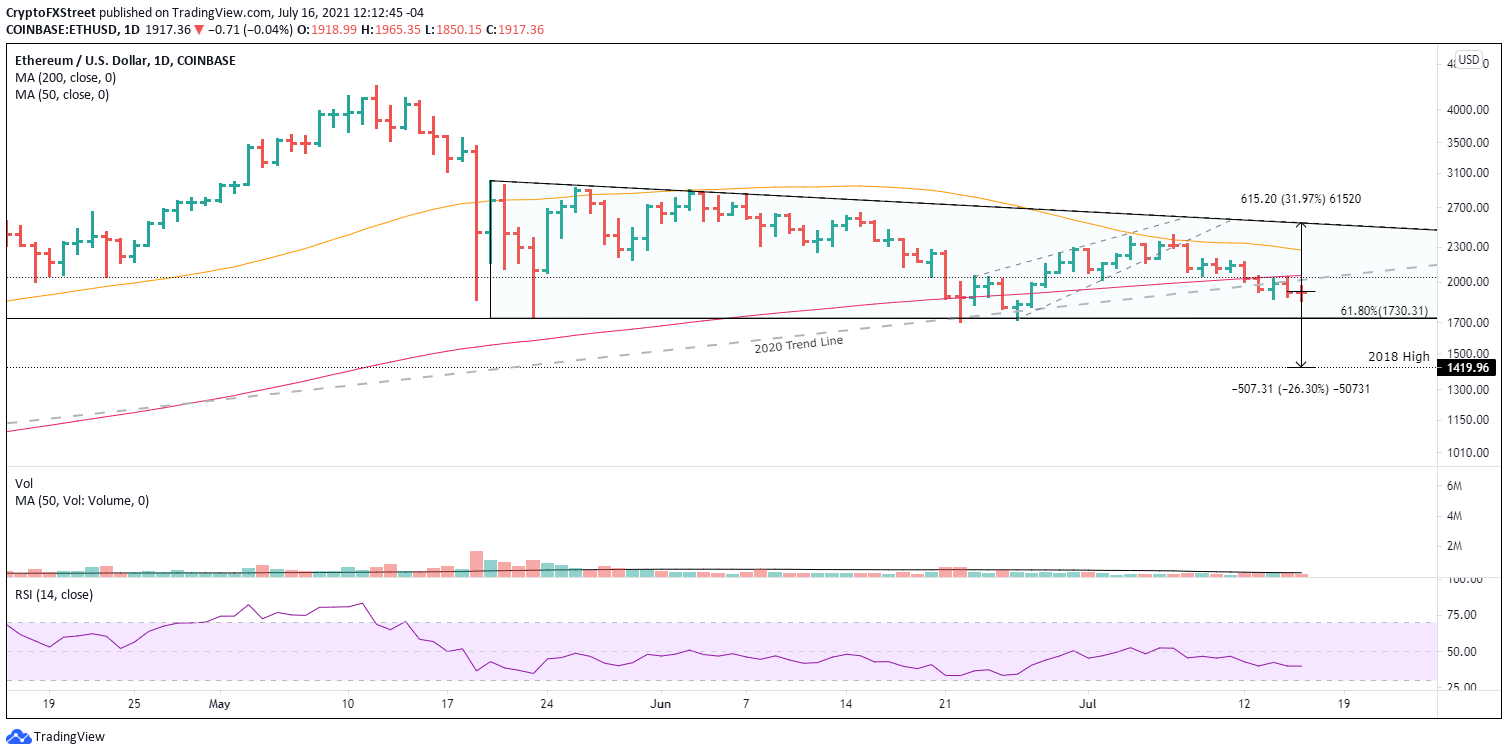
ETH/USD daily chart
The dip below the trifecta of support has not heightened fear levels, suggesting that the weakness will be short-lived. Nevertheless, Ethereum price is at an inflection point, and current directional bias is down and encouraged by a weak cryptocurrency complex.
For now, beware of the potential for a bear trap as ETH sits in no man’s land between the ascending 2020 trend line and the 61.8% retracement level, but do not accumulate until there is a daily close above the previous trifecta of support.
Here, FXStreet's analysts evaluate where ETH could be heading next as it seems bound for an upswing.
XRP price dictates that it is not time to be reckless with investment decisions
Until July 7, XRP price had consolidated above $0.650, but the decline on July 8 dispersed the support, and the level became resistance for the international settlements token. The robustness of the $0.650 level is attributed to the May 23 low of $0.652 and a series of highs going back to early 2021 and December 2020.
The recent XRP price failures to recapture $0.650 indicate that XRP price is expanding the trading range that has governed price action since the end of June. Key range levels include the 200-day SMA at $0.747 on the upside and the 78.6% retracement of the 2021 rally at $0.555.
A bullish development resulting from the tight XRP price action is a sharp contraction of the Ripple 14-day Average True Range (ATR) back to the April levels that preceded the relentless spike to $1.96. In fact, ATR readings near current levels have often preceded price thrusts of varying degrees.
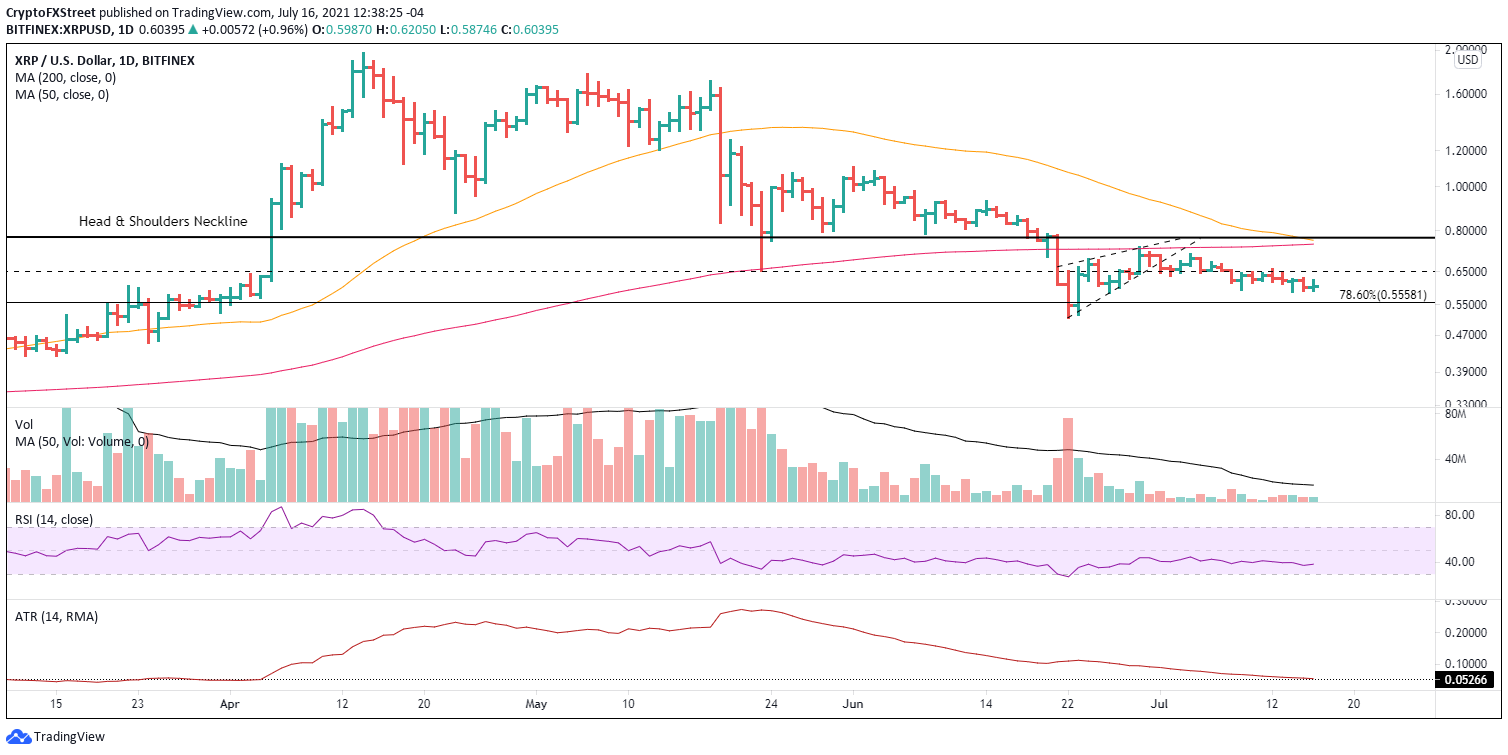
XRP/USD daily chart
Of course, the contraction in volatility could extend for weeks, but at the very least, it should prompt Ripple investors to acknowledge the potential inherent in the recent price action. Without the volatility, XRP price will remain stranded between $0.747 and $0.555. For that reason, it is encouraged that speculators refrain from reckless investment decisions until confirmation can be realized.
One final point of consideration is that Ripple is nearing a bearish Death Cross pattern on the daily chart as the 50-day SMA closes in on the 200-day SMA, establishing more downward pressure on XRP price.
Here, FXStreet's analysts evaluate where Ripple could be heading next as it seems bound for an upswing.
Author

Sheldon McIntyre, CMT
Independent Analyst
Sheldon has 24 years of investment experience holding various positions in companies based in the United States and Chile. His core competencies include BRIC and G-10 equity markets, swing and position trading and technical analysis.


