Top 3 Price Prediction Bitcoin, Ethereum, Ripple: Crypto market plays on the scoreline for fresh highs
- Ripple and Ethereum have broken key resistance levels bringing the market to the edge of a bullish run.
- Bitcoin should break the $8000 resistance and complete the bullish festival before the halving.
- Market sentiment remains at fear levels and reinforces upward potential.

Crypto board leaders, who were at a crossroads yesterday, have chosen a path and it is the one that points to the high side of the price band. Early in the morning, Ether has broken the $200 resistance against the US dollar, and Bitcoin has done the same with the long-term downward trend line and is now heading for the confluence of the 200-day simple moving average and the 100-day simple moving average at the critical $8000 level.
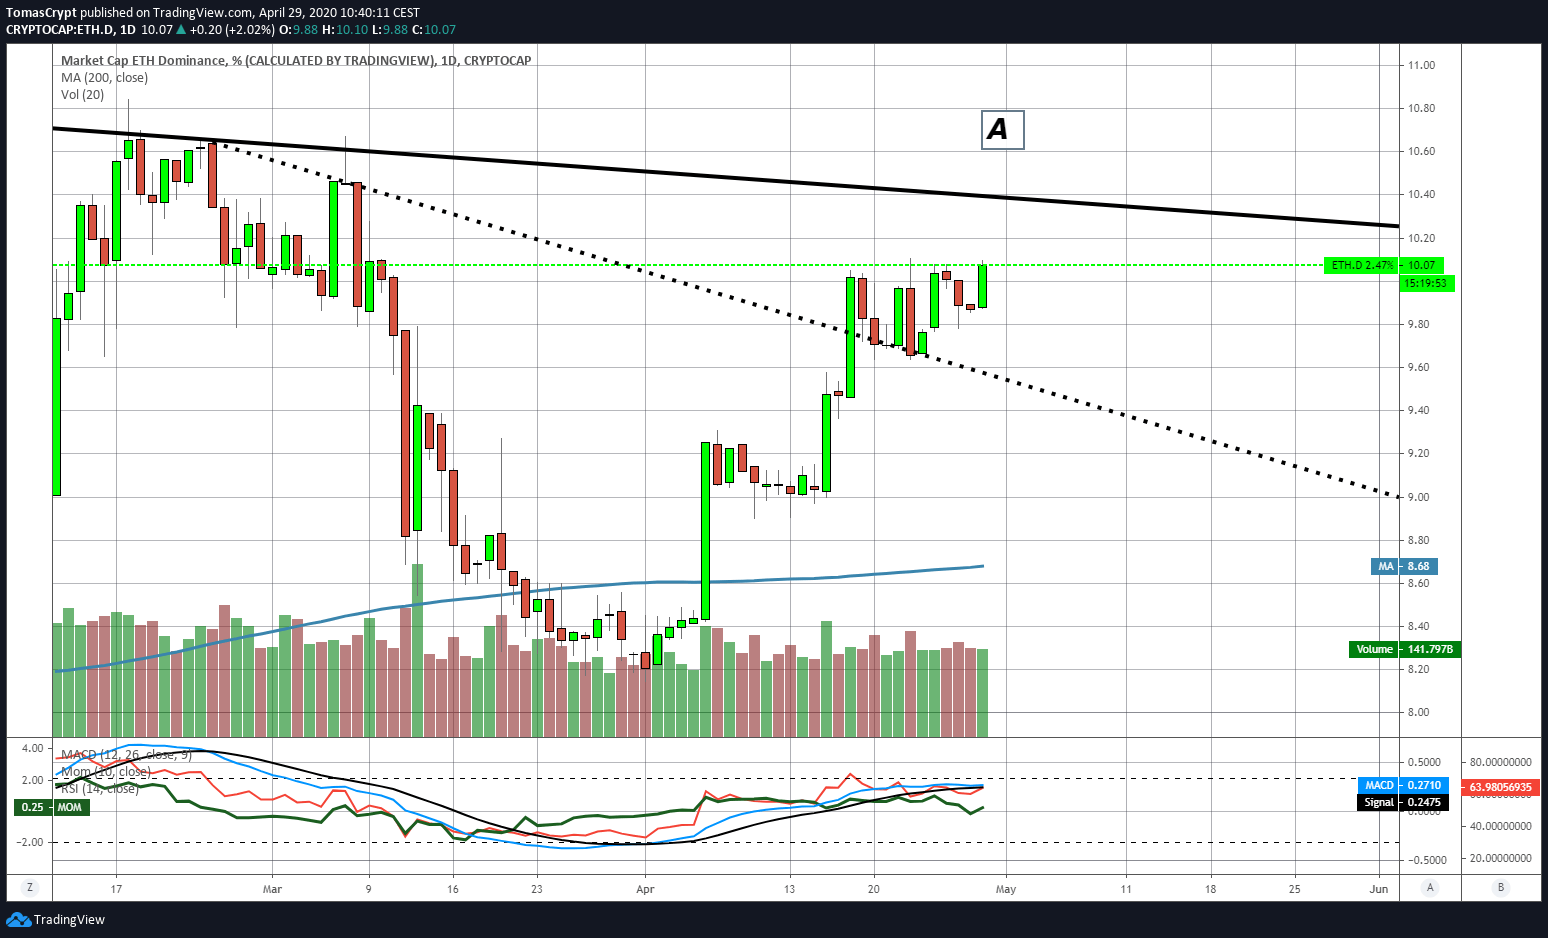
Leading the uptrend is Ether, improving its market share by more than 2.1% and getting very close to a breakout of the consolidation pattern it has been moving in for days.
Yesterday the XRP/USD pair moved quickly above the $0.20 level and is fighting now the critical resistance level of $0.22. Also, as I explain in detail in the specific section of XRP, the indicators are activating bullish patterns.
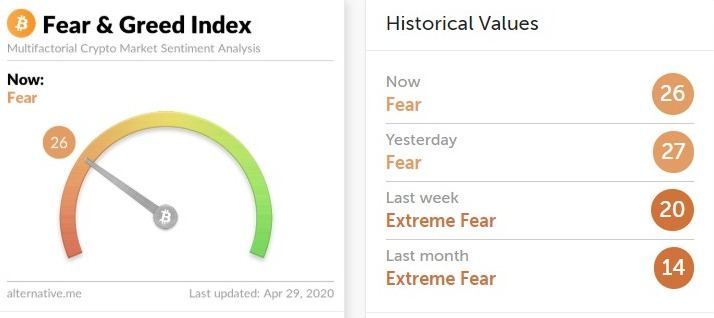
The crypto market sentiment levels do not match the morning breakout and traders will have to wait for tomorrow's readings to see if the group sentiment fits bullish movement. At press time, the market sentiment indicator prepared by alternative.me is at level 26 – reflecting fear in the market.
The entire crypto market is close to a new – and potentially very bullish – scenario. Details do not confirm the breakthrough, but the Top 3 plays on the scoreline and the fight between the bears and the bulls can be fierce.
ETH/BTC Daily Chart
The ETH/BTC pair is currently trading at the price level of 0.0258 and is attempting to break out of the triangle consolidation pattern. This breakout needs to be confirmed to validate today's upward movement.
This cross pair is the most reliable indicator to confirm or deny breaks in crucial supports and resistances, and the market's focus for today.
The main moving averages increase the bullish profile and acquire a very pronounced upward slope that supports the bullish run.
Above the current price, the first resistance level is at 0.026, then the second at 0.0268 and the third one at 0.0278.
Below the current price, the first support level is at 0.0251, then the second at 0.0242 and the third one at 0.0237.
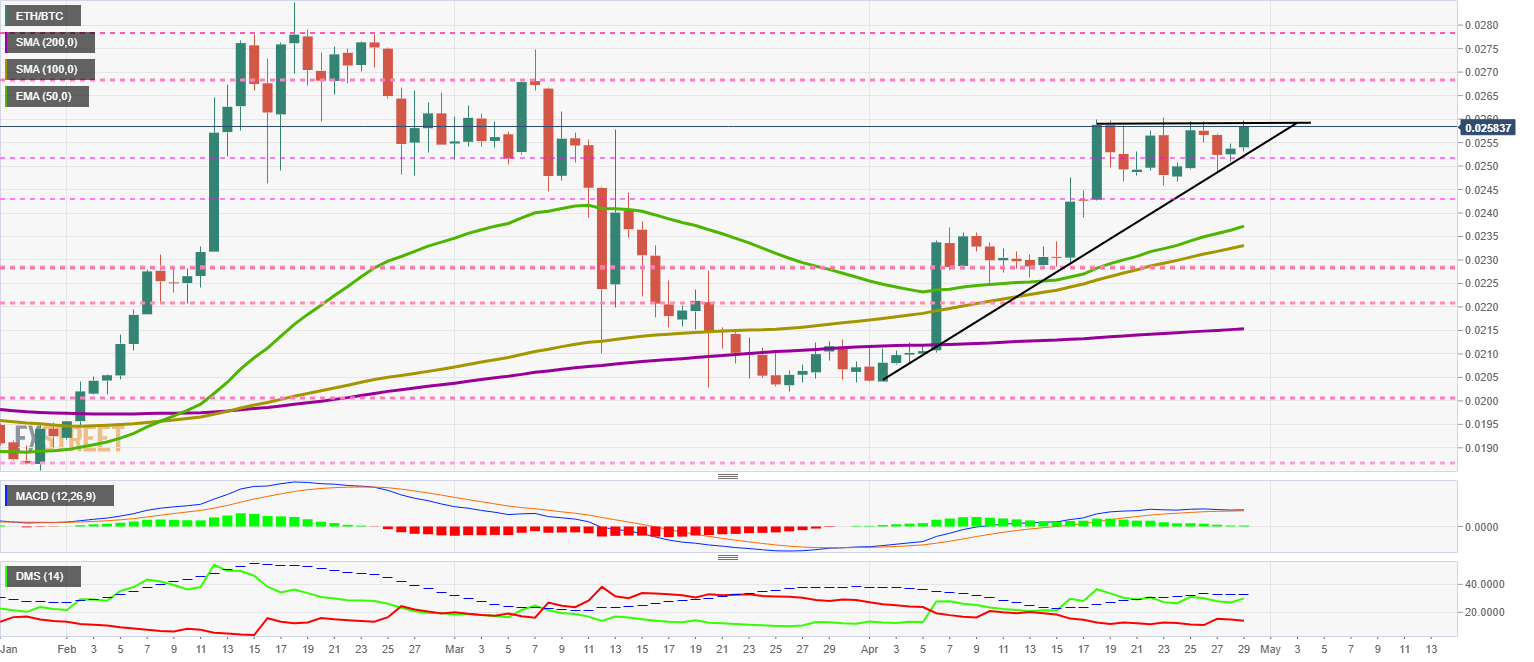
The MACD on the daily chart retains the flat profile of the last few days. If there is not a consistent upward breakout, it will be challenging to get the necessary bullish profile to see a medium-term upward movement.
The DMI on the daily chart shows that the bulls are moving up again, but they will need to break the ADX line to avoid a downward bounce that would be very detrimental at this time. The bears are losing some of their strength but are holding on to considerable highs.
BTC/USD Daily Chart
The BTC/USD pair is currently trading at the price level of $7955 and is struggling to overcome the stiff resistance formed by the confluence of the major moving averages and the key level of $8000.
Bitcoin has broken through the long-term downward trend early in the day and has the opportunity now to confirm the breakout and trigger very powerful buy alerts.
Above the current price, the first resistance level is at $8000, then the second at $8200 and the third one at $8400.
Below the current price, the first support level is at $7850, then the second at $7750 and the third one at $7600.
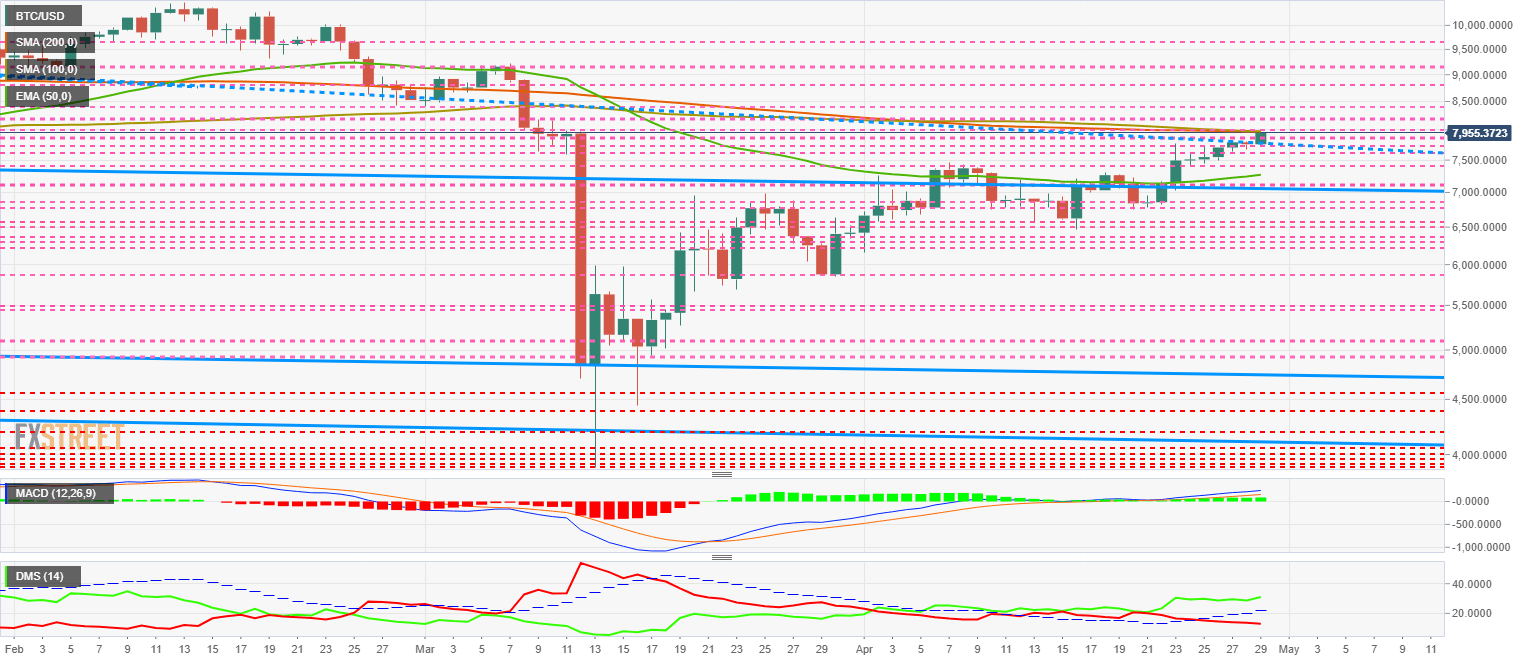
The MACD on the daily chart shows an improvement from yesterday's levels. Moving averages are increasing the upward slope and also gaining separation between them.
The DMI on the daily chart shows bulls picking up speed sharply, while bears are holding on to their downward slope. The structure is perfect for seeing a breakout from the current resistance levels.
ETH/USD Daily Chart
The ETH/USD pair is currently trading at $205.4 after breaking through the $200 level. Congestion resistance at $208 is holding the price up at this time.
The 50-day exponential moving average crosses above the 200-day simple average and sends another positive signal regarding the current movement.
Above the current price, the first resistance level is at $208, then the second at $215 and the third one at $222.
Below the current price, the first support level is at $200, then the second at $195 and the third one at $190.
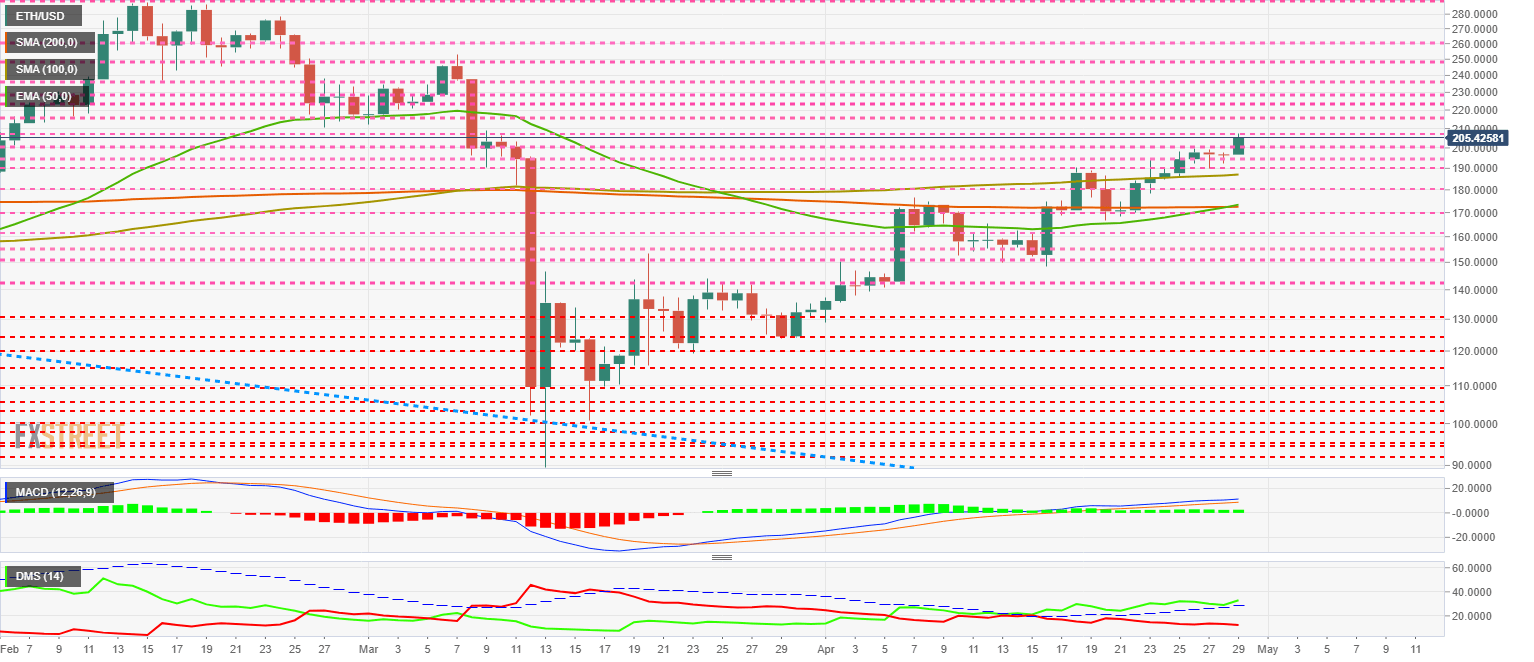
The DMI on the daily chart shows a bullish bounce, after yesterday's bullish run to support the ADX line. The bears confirm the bullish momentum and continue their downward movement.
XRP/USD Daily Chart
The XRP/USD pair broke through the critical resistance level yesterday at $0.20 and gained a further 10% to the $0.22 level. The structure of the major moving averages is very horizontal, and only the 50-day exponential moving average is following the price up.
Above the current price, the first resistance level is at $0.22, then the second at $0.229 and the third one at $0.24.
Below the current price, the first support level is at $0.20, then the second at $0.194 and the third one at $0.19.
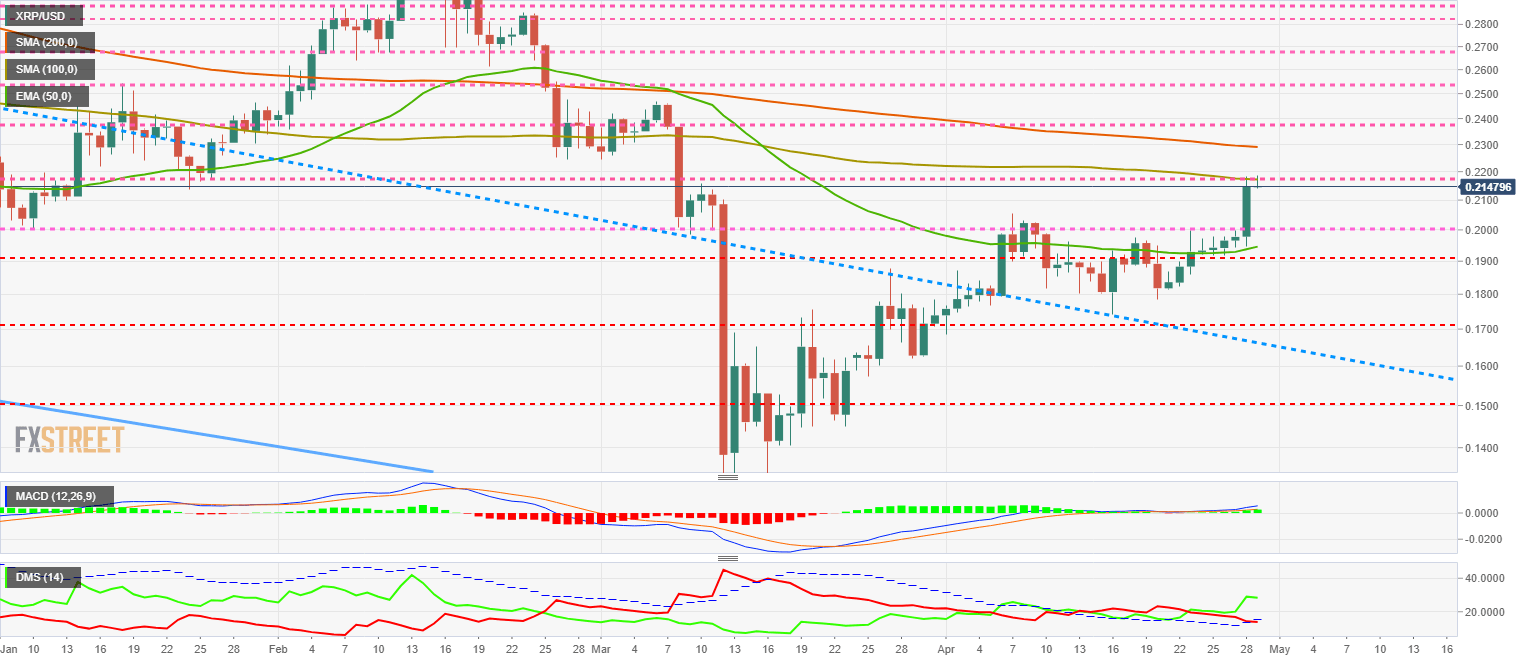
The MACD on the daily chart shows a significant improvement from yesterday's movement. After many days of a completely flat profile, the moving averages are leaning upwards and giving hope to the buying side.
The DMI on the daily chart shows the bulls rushing higher. The bears have lost the support of the ADX line and triggered a bullish pattern for the XRP/USD pair.
Author

Tomas Salles
FXStreet
Tomàs Sallés was born in Barcelona in 1972, he is a certified technical analyst after having completing specialized courses in Spain and Switzerland. He expanded his technical training following the guidance of great experts on the financial markets.




