Top 3 Price Prediction Bitcoin, Ethereum, Ripple: Crypto market bull cycle hits pause
- Bitcoin rejected from $13,500, forced to retest the 50 SMA support while $12,500 beckons.
- Ethereum price slides to the critical support established at $380 amid a potential breakdown to $370.
- Ripple is back in the hands of the bears as a breakdown to $0.22 primary support looms.

Cryptocurrencies across the board are succumbing to intensifying selling pressure, led by Bitcoin. The flagship cryptocurrency reversed the trend upwards on Thursday, stepping above $13,500. However, a gust of headwinds sent chills across the entire market as BTC has slid to $13,000 again.
All the major cryptocurrencies are nursing wounds, especially those in the top ten. Polkadot is the worst-hit after losing over 8% of its value over the last 24 hours. Binance Coin (BNB) has also struggled to sustain its uptrend, hence a 6.6% loss. Similarly, Chainlink is down 5.8% in the same period to trade at $10.9.
The total market capitalization has dived to $394 billion after rising to a weekly high of $409 billion. On the flip side, the 24-hour trading volume surged to $157 billion from $100 billion at the peak, highlighting the ongoing selloff.
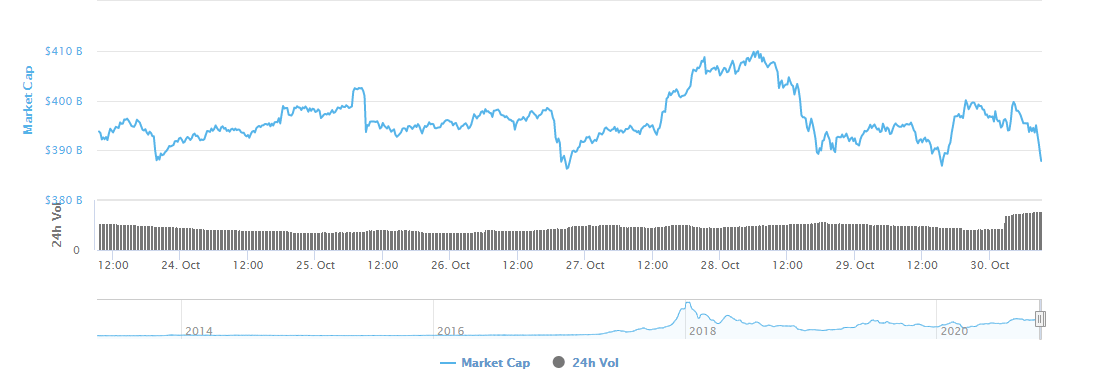
Crypto market cap chart
Bitcoin downside eyes $12,500 if key support fails to hold
The bellwether cryptocurrency is in the middle of a retreat from levels slightly above $13,500. The drop has triggered a minor end-of-the-week selloff in the market. Meanwhile, Bitcoin is hovering above the 50 Simple Moving Average (SMA) in a bid to stop potential losses below $13,000.
According to the Relative Strength Index (RSI), BTC/USD is mainly in the bears' hands. Buyers must defend the support at the 50 SMA as well as $13,000; otherwise, declines may extend below $12,500, perhaps even test the 100 SMA.
 (56)-637396400660234495.png)
BTC/USD 4-hour chart
It is worth mentioning that the bearish outlook will be invalidated if the 50 SMA support remains intact and BTC resumes the uptrend, settling above $13,500. Price action to $14,000 is likely to suffer rejection around June 2019's high. However, if BTC/USD sails above $14,000, it would dash to $15,000.
Ethereum is on the verge of a breakdown to $370
Ethereum has retreated by almost 10% from October highs at $420 due to the consistently growing bearish grip. Selling pressure also surged, particularly under $400.
The latest blow is the break beneath a critical ascending trendline, pulling the price to the support at $380. If a reversal fails to come into play, the lower leg may extend to the 200 SMA (marginally above $370) in the 4-hour timeframe. The Relative Strength Index (RSI) reinforces the selling pressure as it dives to the oversold area.
 - 2020-10-30T094908.411-637396401275618421.png)
ETH/USD 4-hour chart
On the other hand, the bearish narrative will be invalidated if Ethereum reclaims the ascending trendline support. Similarly, if Ether closes the day above the 100 SMA, the price may shoot to $400 and possibly test the 50 SMA resistance. It is essential to keep in mind that price action towards $420 may be delayed due to the seller congestion at $410.
Ripple bulls nursing wounds
The cross-border cryptocurrency continued with the downswing as anticipated on Thursday. A break under the ascending triangle channel triggered a selloff as more sellers joined the market. Besides, Ripple closed the day below the 200 SMA, adding credence to the bearish outlook.
XRP/USD is teetering at $0.237 amid a progressing downward momentum. The Moving Average Convergence Divergence (MACD) is reinforcing the selling pressure as it explores the negative region. Also, a bearish divergence from the MACD highlights the intense grip of the sellers. If short-term support at $0.2350 caves, XRP could plunge to $0.23 and $0.22, respectively.
-637396402140434225.png)
XRP/USD 4-hour chart
To invalidate the bearish outlook, XRP must reclaim the ground above the recently broken hypotenuse of the ascending triangle. Similarly, closing above the 200 SMA will strengthen investors' confidence in the recovery mission to $0.26 (x-axis).
Author

John Isige
FXStreet
John Isige is a seasoned cryptocurrency journalist and markets analyst committed to delivering high-quality, actionable insights tailored to traders, investors, and crypto enthusiasts. He enjoys deep dives into emerging Web3 tren


