Bitcoin Price Analysis: BTC decouples further away from the SPX
- Popular analyst Willy Woo noted that BTC’s organic investor velocity provides it with strong, safe haven properties.
- The relative strength index (RSI) is hovering in the overbought zone signaling a short-term bearish correction.

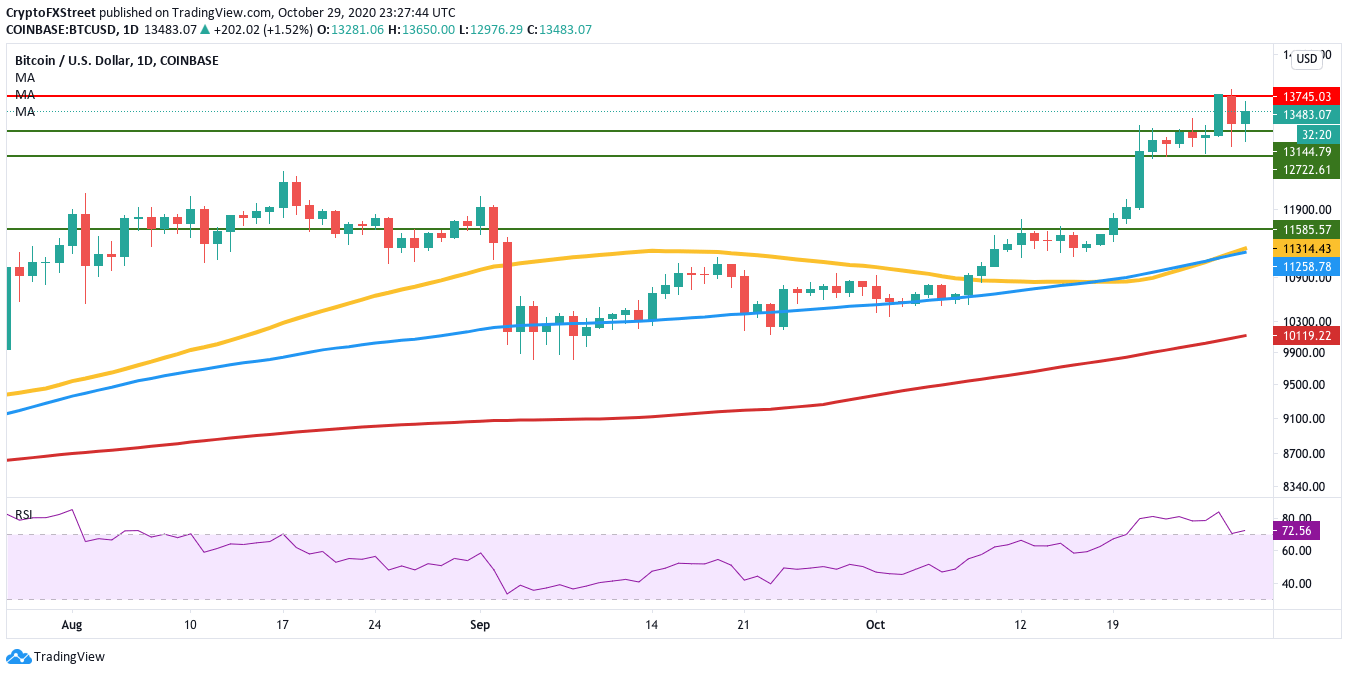
After finding support at the 50-day SMA, Bitcoin has steadily climbed from $10,600 to $13,800 in three weeks between October 7 to October 27. Since then, the premier cryptocurrency has managed to settle itself around $13,415. Despite this Wednesday’s bearish movement, the overall outlook so far has been bullish.
Bitcoin decoupling from stocks
Popular BTC analyst Willy Woo noted that BTC is effectively decoupling away from the SP500. In the image below, the BTC/USD price has two different charts superimposed on each other. One is speculative trading that correlates to the SP500 index (SPX), while the other is the NVT price. Bitcoin`s NVT is calculated by dividing the Network Value (market cap) by the daily USD volume transmitted through the blockchain.
In simple words, the NVT represents the organic investor velocity on the Bitcoin blockchain. This price happens to be climbing upward and uncorrelated and preventing speculators from trading the correlation downwards. This shows that even if the stock market collapses, Bitcoin looks strong and secure enough not to follow trends and provide good safe haven properties.
First signs of de-coupling behaviour spotted between BTC and stocks.
— Willy Woo (@woonomic) October 29, 2020
Buying from an influx of new users provides price support preventing speculators from trading the correlation downwards.
NVTP approximates a valuation for BTC with organic investor velocity on the blockchain. pic.twitter.com/AvilB9cfdD
Bitcoin to face short-term bearish correction?
As previously mentioned, BTC bulls have managed to regain control of the market following a bearish Wednesday. The benchmark coin is currently trading for $13,415. A break above the $13,745 could see it cross $15,000. However, the relative strength index (RSI) is hovering in the overbought zone, which could trigger a short-term bearish correction, instead.
BTC/USD daily chart
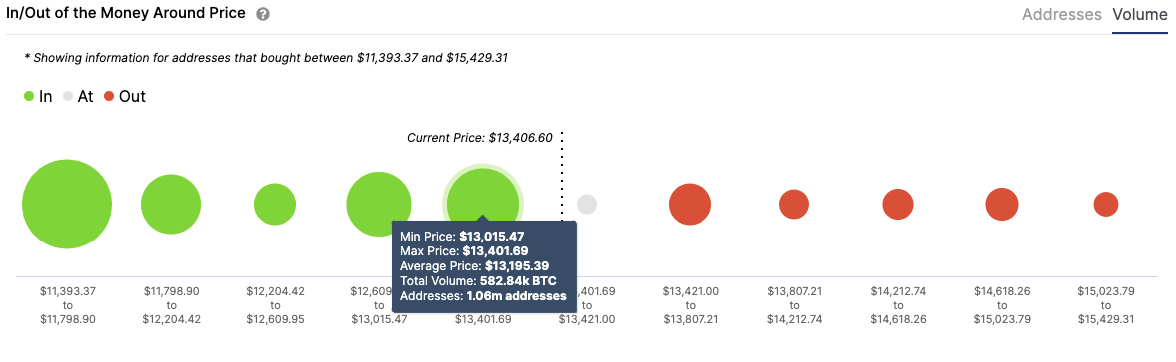
To determine the price's downside potential, let’s take a close look at IntoTheBlock’s IOMAP. The price is sitting on top of a healthy support wall at $13,200, wherein a million addresses had previously purchased 583,000 BTC. A break below this takes us to the next moderate support at $12,775. A further break takes the price all the way down to $11,600.
BTC IOMAP
Key price levels to watch
Bitcoin buyers will want to overcome the $13,745 that thwarted the price this Wednesday. A break above that could see the price cross $15,000.
The downside for the sellers is effectively capped off at $13,200. If the price does break below that, the support wall at $12,775 should absorb the residual selling pressure.
Author

Rajarshi Mitra
Independent Analyst
Rajarshi entered the blockchain space in 2016. He is a blockchain researcher who has worked for Blockgeeks and has done research work for several ICOs. He gets regularly invited to give talks on the blockchain technology and cryptocurrencies.


