Top 3 Price Prediction Bitcoin, Ethereum, Ripple: Bull run for crypto market dominance
- Ethereum takes the lead and sets the course for a new yearly high.
- XRP could be classified as an investment asset, which would add value to Ripple's business.
- Fear remains the predominant feeling, a positive factor in the short term.

This week the crypto market appears to be starting with positive expectations and the main assets of the cryptocurrency universe are pointing to possible gains on the horizon.
Ethereum gains new ground in its fight for dominance against Bitcoin, and from the 0.025 level, it shows intentions to move towards the first resistance level at 0.0258.
The consolidation of the ETH/BTC bullish breakout would be extremely promising for Ethereum and also for the entire Altcoin segment and the expected significant price increases.
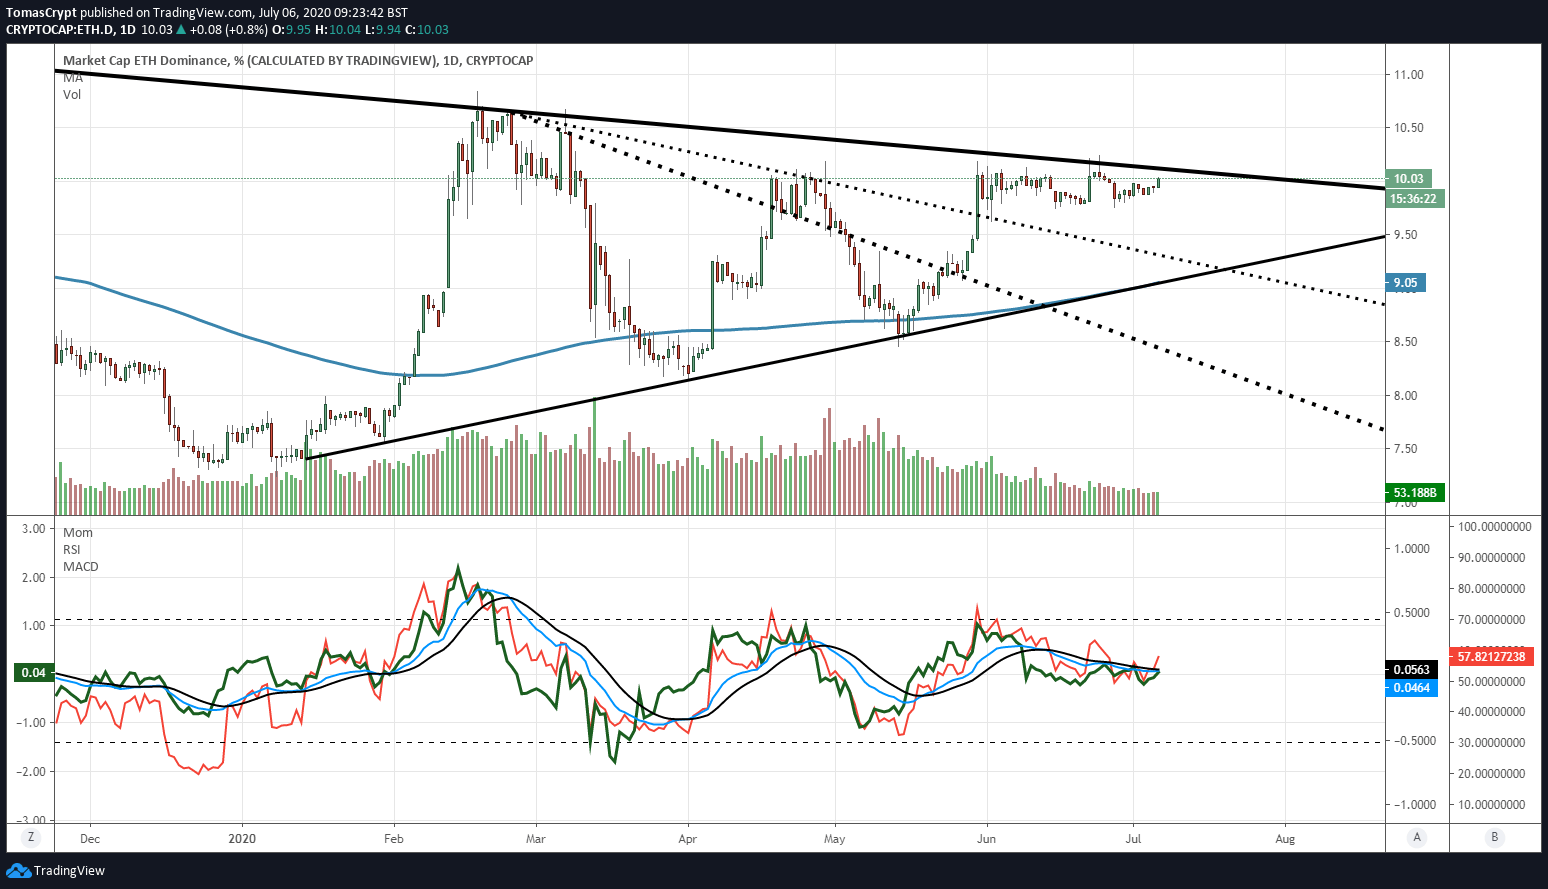
Ethereum moves at the 10.00 level of dominance of the whole crypto market and approaches the major resistance at 10.12 again. This resistance is the second level to be watched by the analysts who follow this war for dominance between Bitcoin and Ethereum.
Today's controversy has its focus on Ripple and its XRP. The dispute to classify XRP as investment or not keeps Ripple's hodlers on edge. A valuation that would give investor rights to XRP holders would actively boost price expectations.
At a time when the price of the XRP is low, a decision in favor of classifying the XRP as an investment could have very positive effects on the price.
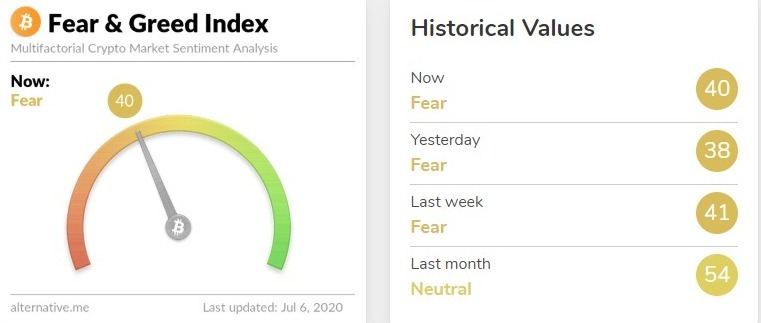
The market sentiment level is worsening and remains at level 40 today after yesterday's foray into level 38. A market with fear is a favorable environment for bullish surprises.
ETH/BTC Daily Chart
The ETH/BTC pair is currently trading at the price level of 0.02534 and has shown significant buying interest since the opening of the Asian session.
Above the current price, the first resistance level is at 0.0258, then the second at 0.0276 and the third one at 0.0295.
Below the current price, the first support level is at 0.0248, then the second at 0.0235 and the third one at 0.0225.
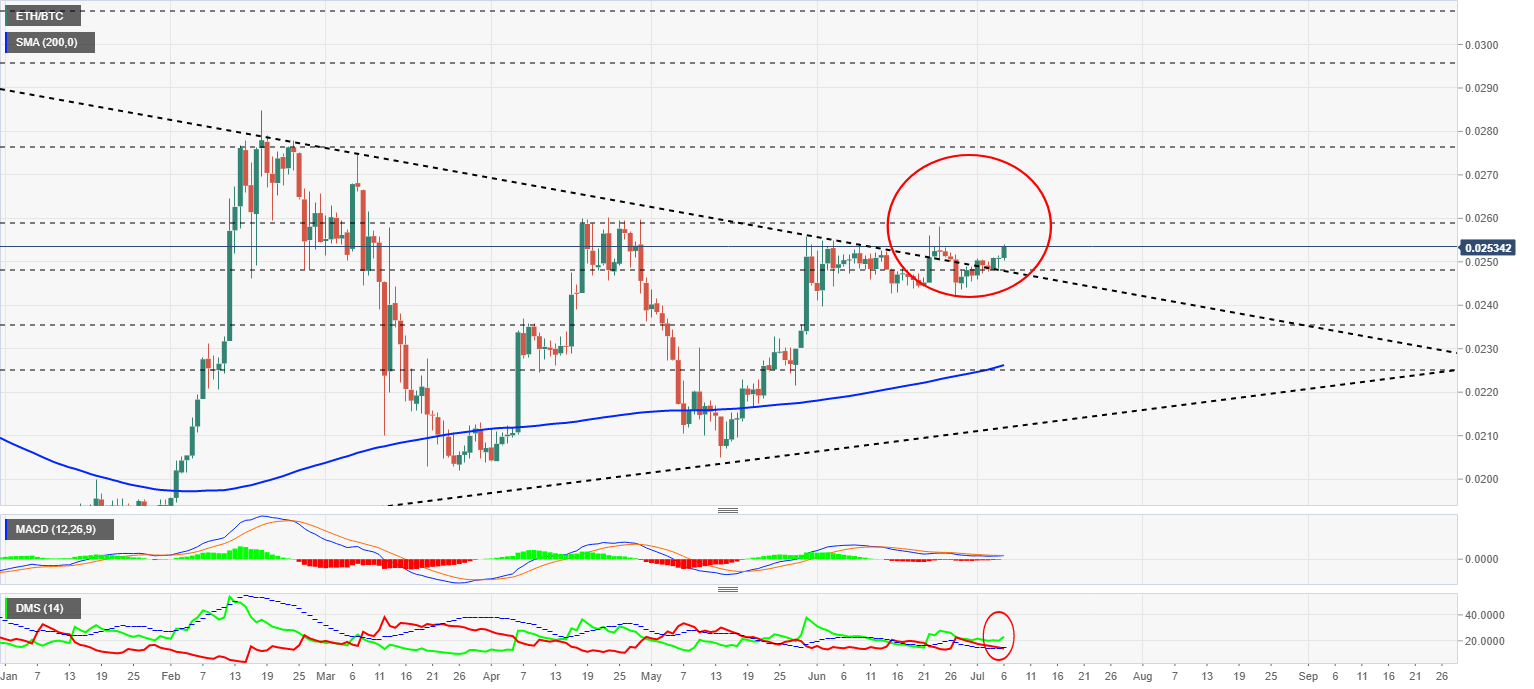
The MACD on the daily chart tilts slightly upward from a very flat structure, with the moving averages overlapping, making the indicator less visible.
The DMI on the daily chart shows bulls taking distance from bears. The sell-side is already moving below the ADX line, a technical event that would finally trigger the bullish pattern in the ETH/BTC pair.
BTC/USD Daily Chart
The BTC/USD pair is currently trading at the price level of $9201 and is moving towards the first resistance level at the price level of $9500. The 200-day simple moving average is sloping higher and could support the continuation of the uptrend.
Above the current price, the first resistance level is at $9500, then the second at $10400 and the third one at $11400.
Below the current price, the first support level is at $8950, then the second at $8730 and the third one at $8400.
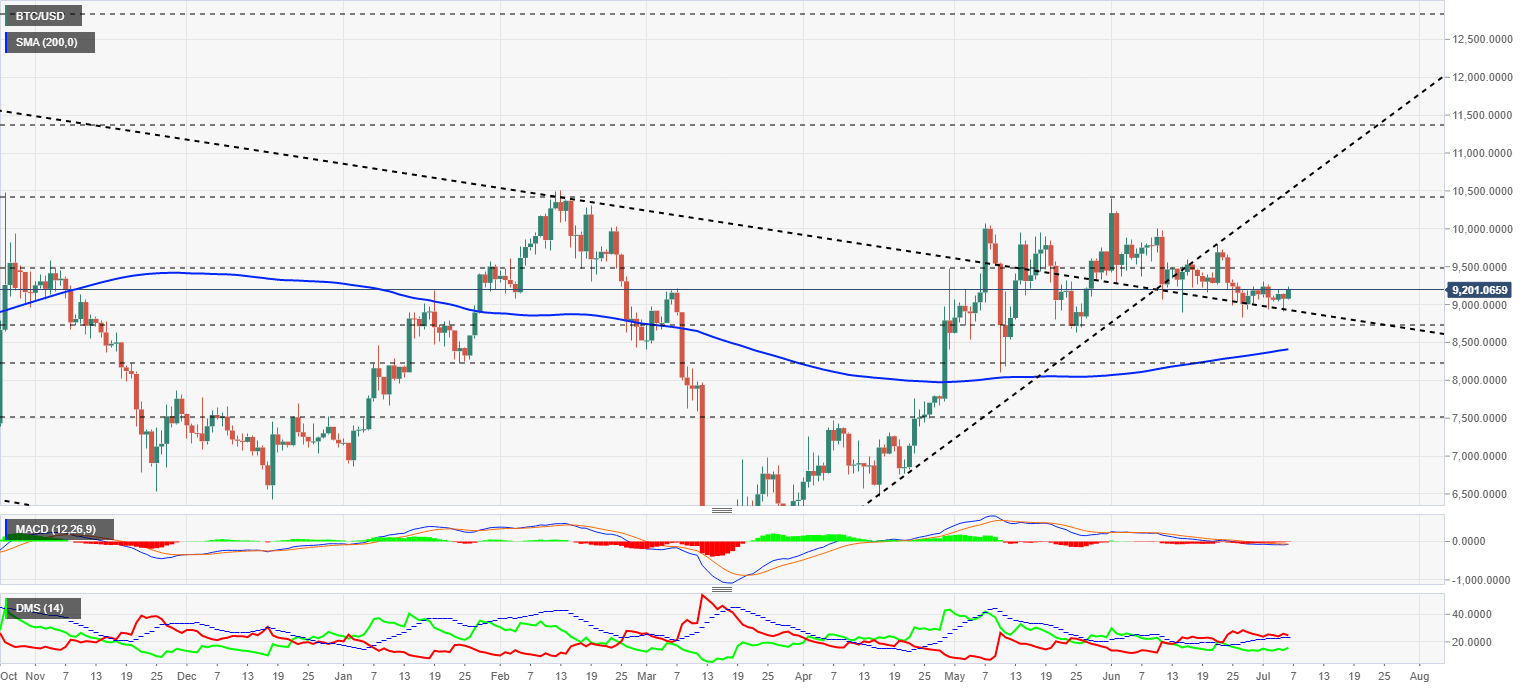
The MACD on the daily chart is turning upward but starting from a very flat profile that invites skepticism about the potential for movement.
The DMI on the daily chart shows the bears again looking for support on the ADX line as the bulls move upwards and may attempt a change of leadership in the BTC/USD pair.
ETH/USD Daily Chart
The ETH/USD pair is currently trading at $232.8 after a first attempt to break through price congestion resistance at $234. The current bullish scenario for Ethereum is to break through the $261 level, from where it could develop in search of new yearly highs.
Above the current price, the first resistance level is at $234, then the second at $246 and the third one at $261.
Below the current price, the first support level is at $221, then the second at $200 and the third one at $195.
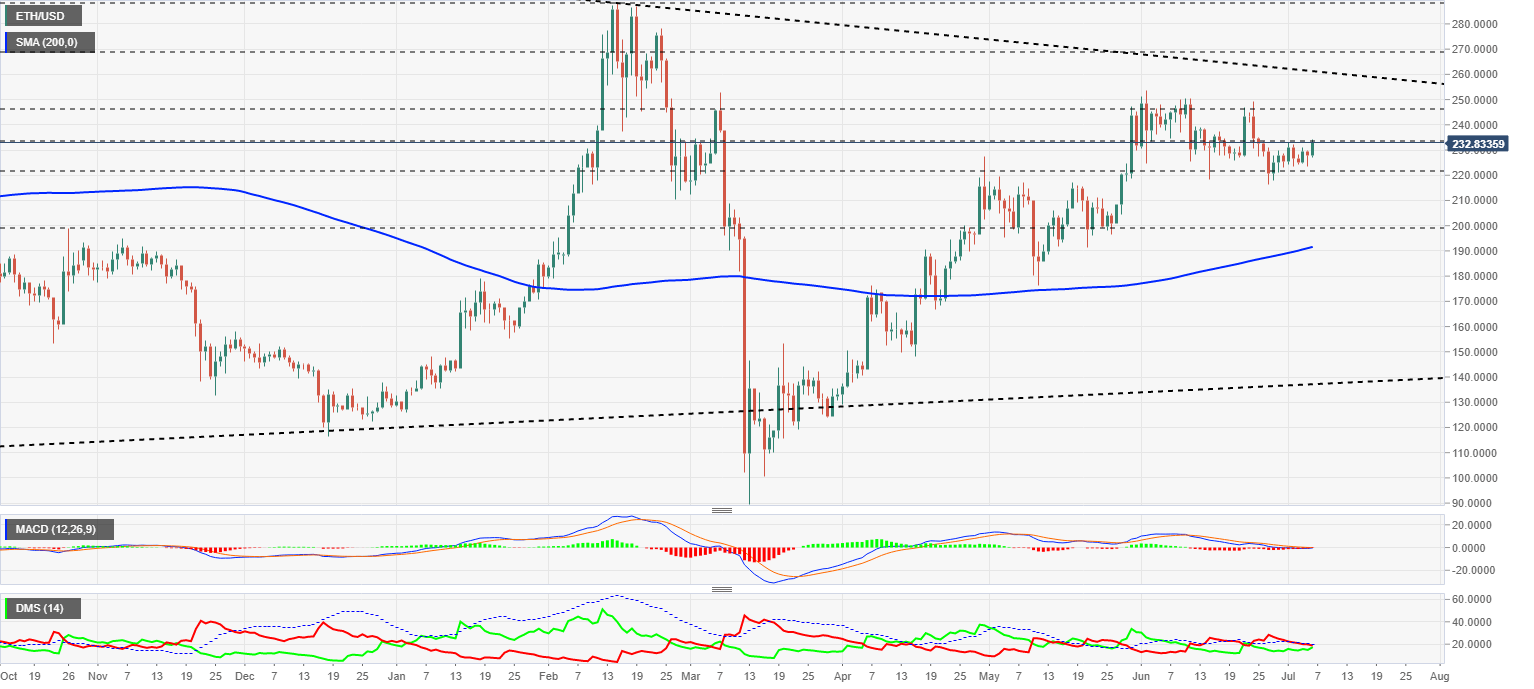
The MACD on the daily chart finds support in the zero levels of the indicator and shows signs of a possible upward shift.
The DMI on the daily chart shows bulls attempting to take the lead in the ETH/USD pair in the face of bears losing support from the ADX line and disabling the bearish pattern. The current structure of the Directional Movement Index indicates a strong probability of a major upward movement in ETH/USD.
XRP/USD Daily Chart
The XRP/USD pair trades at $0.182 and seems to come back to life after a couple of weeks in the underworld. Today's uptrend has left it at the gates of resistance due to price congestion at $0.19. The 200-day simple moving average is walking around the $0.21 level and exerts a significant pull on the price.
Above the current price, the first resistance level is at $0.19, then the second at $0.195 and the third one at $0.20.
Below the current price, the first level of support is at $0.163, then the second at $0.14 and the third one at $0.113.
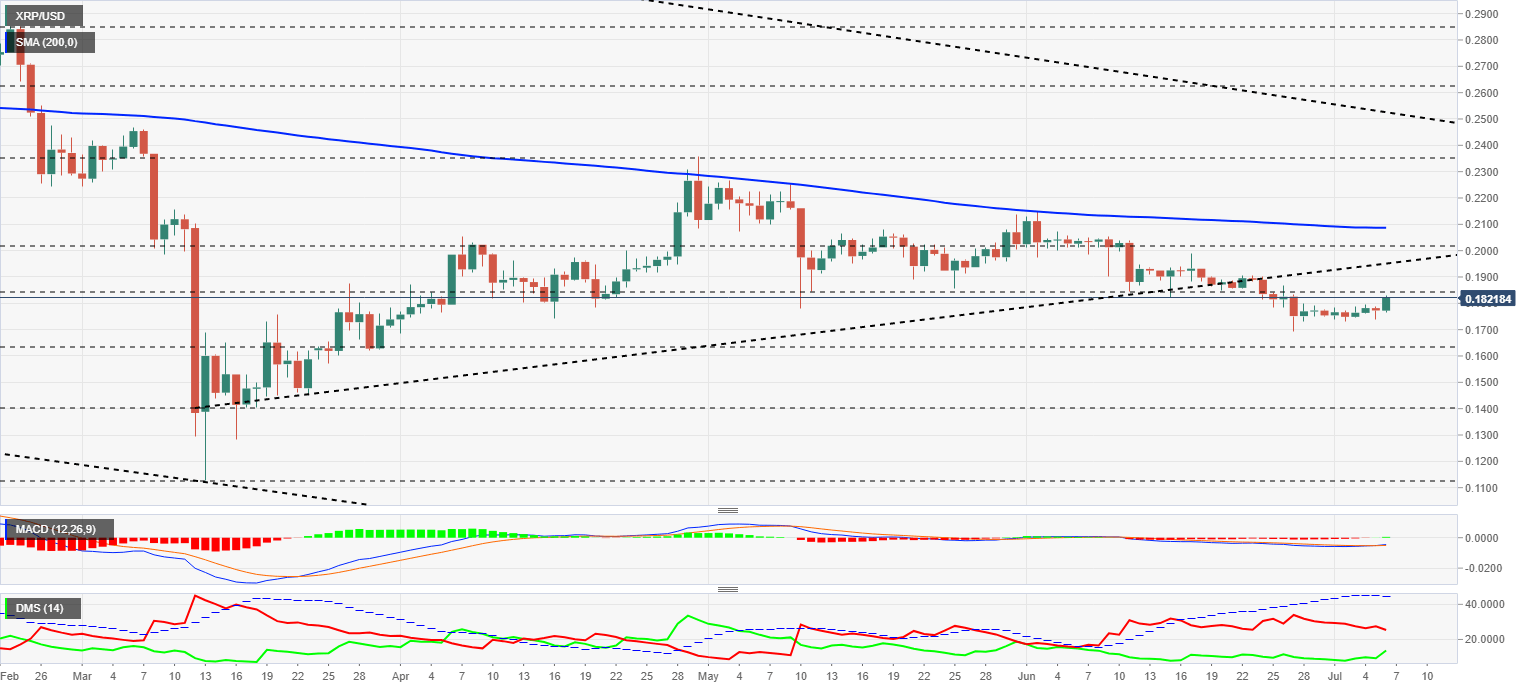
The MACD on the daily chart is crossing higher and confirms the improved scenario for XRP/USD. The proximity of the 0 levels of the indicator could complicate a medium-term bullish development.
The DMI on the daily chart shows significant improvement by the bulls, which seem determined to take control of XRP/USD. The bullish side has not led since the beginning of May.
Author

Tomas Salles
FXStreet
Tomàs Sallés was born in Barcelona in 1972, he is a certified technical analyst after having completing specialized courses in Spain and Switzerland. He expanded his technical training following the guidance of great experts on the financial markets.