Top 3 Price Prediction Bitcoin, Ethereum, Ripple: BTC continues to range higher, but altcoins suffer
- Bitcoin price has experienced a 32% upswing over the past six days and might retrace to gather more steam.
- Ethereum price performance is lackluster as it rallied roughly 17% in the same period as BTC.
- The same can be said for Ripple price, but it sits atop a stable support barrier that could push it higher shortly.

Bitcoin price has been on a tear lately, but Ethereum and Ripple have failed to perform as fear plagues the cryptocurrency markets. As a result, altcoins are down in the dumps with their dull rallies.
Going forward, investors can expect a similar trend to continue for a majority of the cryptocurrencies.
Bitcoin price shows strength
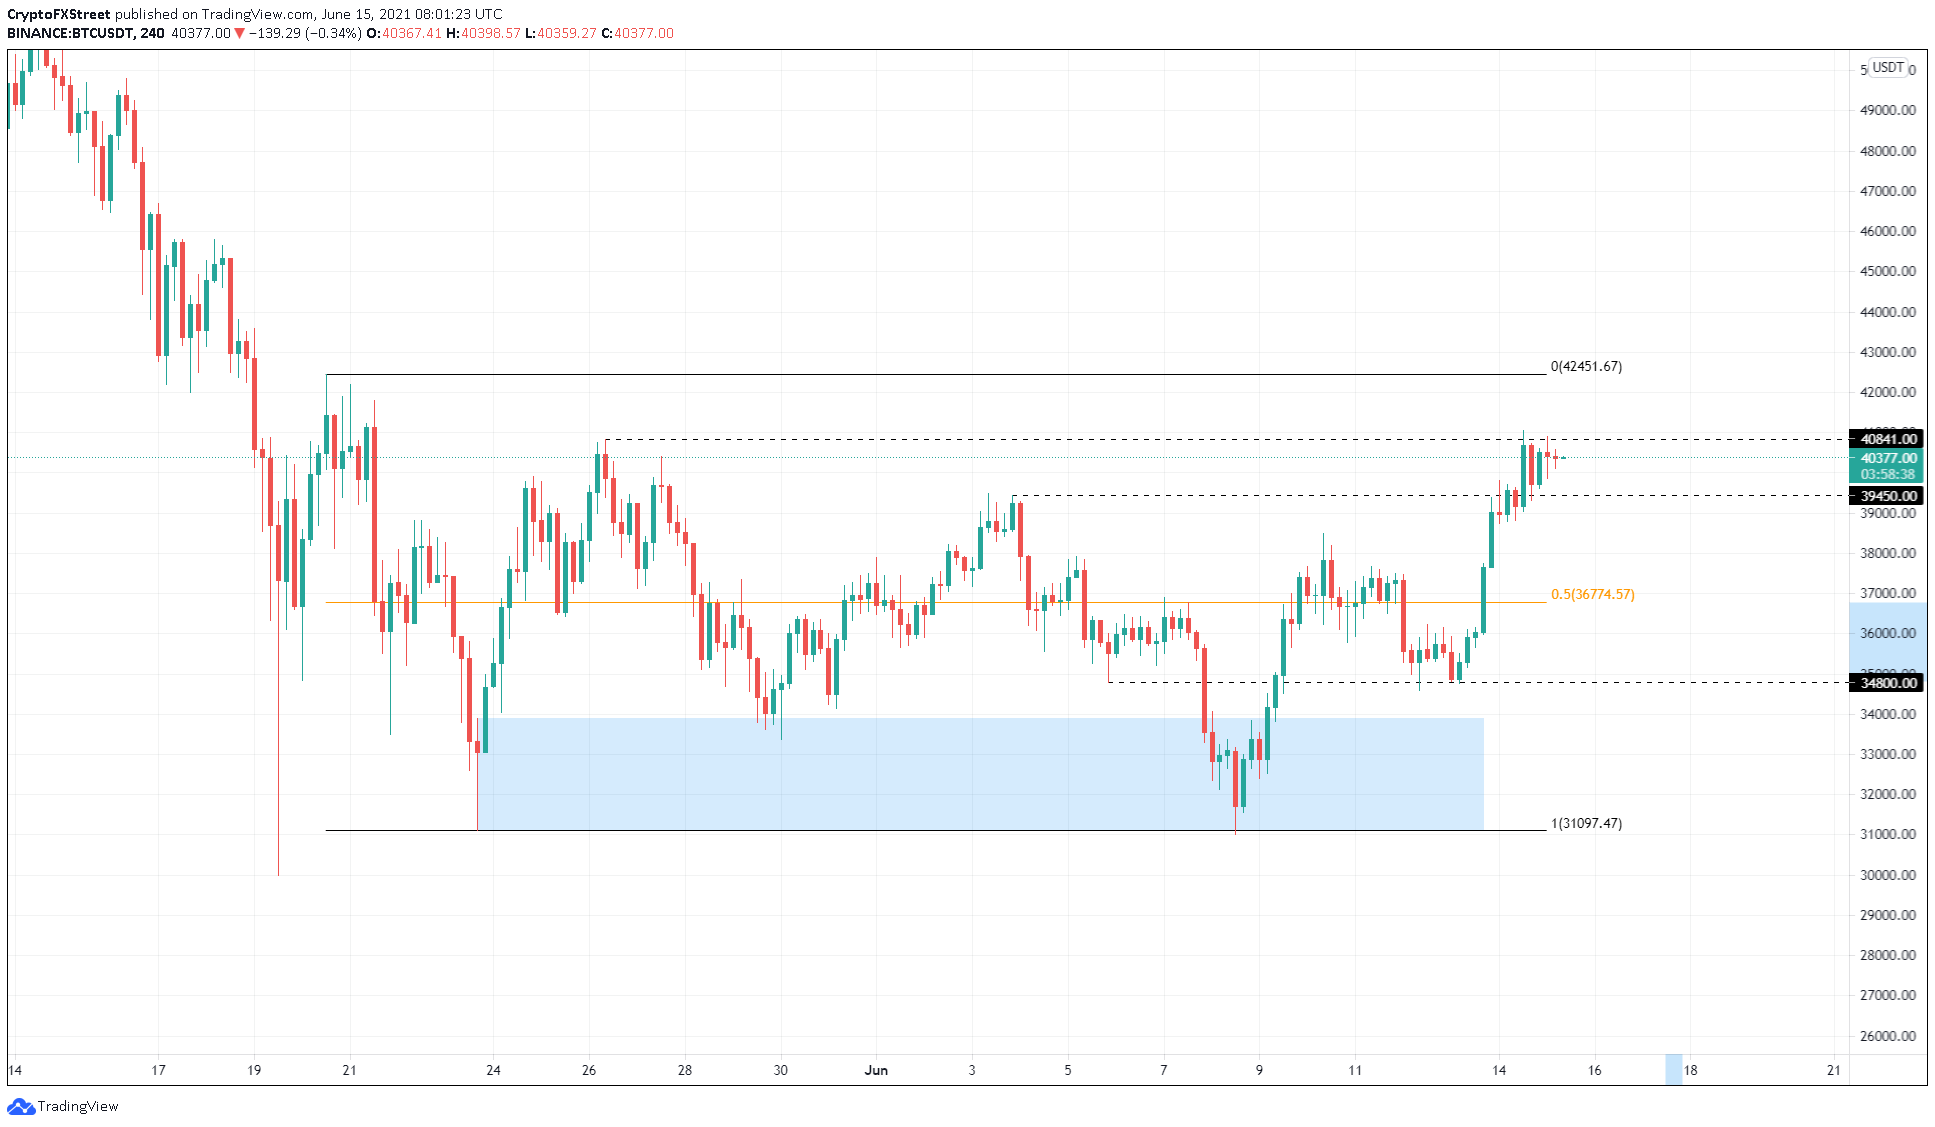
Bitcoin price has been on an upswing since it set up a local bottom at $31,000 on June 8. The rally that emerged after this low spanned 32%, leading BTC to cross $40,000 and created a swing high at $41,064.
However, a 4-hour candlestick close below the resistance level at $40,841 signaled that a further uptrend might be unlikely, at least in the short term.
A consolidation between $40,841 and $39,450 seems likely before the next leg evolves. It is also possible that BTC heads lower to retest the 50% Fibonacci retracement level at $36,774 before resuming its rally. In certain conditions, Bitcoin price might even sweep lower than $36,774 to collect liquidity that provides an extra oomph for the upswing.
Regardless, the bulls’ target remains the same: the range high at $42,451, roughly 15% from the mid-way point.
BTC/USDT 4-hour chart
On the flip side, the retracement detailed above could shatter $36,774 and stay below it. If this were to happen, it would invalidate the bullish thesis and result in a 5.4% downswing toward the support level at $34,800.
This correction might dip down to the demand zone in a highly bearish scenario, extending from $31,111 to $33,900.
Ethereum price ponders potential double top formation
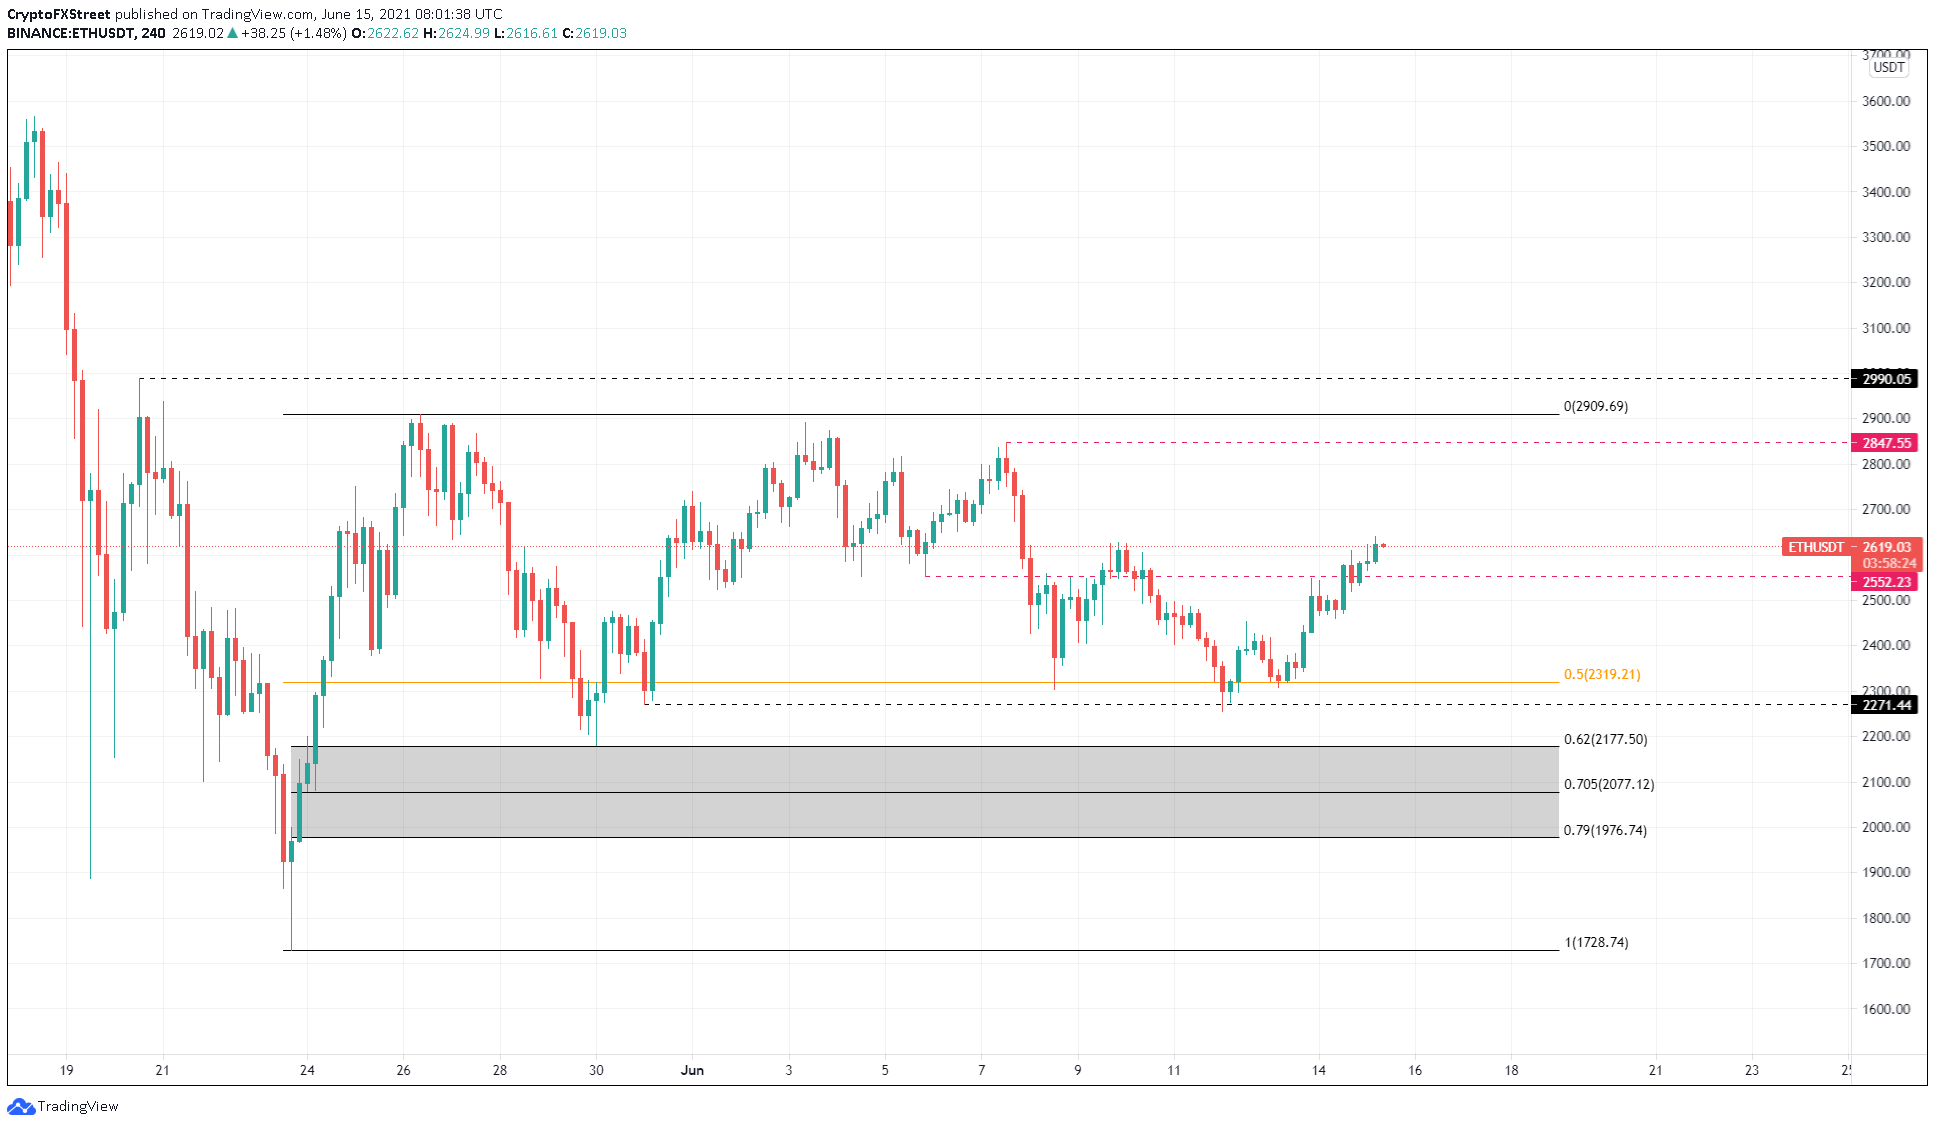
Ethereum price saw a 17% upswing since setting up a swing low at $2,256 on June 12. As ETH hovers around the local high at $2,640, a potential double top formation could lead to a retracement.
The confirmation of a correction will arrive after the sellers breach the support level at $2,552. In such a case, Ethereum price might retest the 50% Fibonacci retracement level at $2,319.
In a highly bearish case, the smart contract token might tag the 62% Fibonacci retracement level at $2,177.
This retest would provide the perfect opportunity to accumulate Ethereum for a short-term 33% price swing toward the range high at $2,909.
ETH/USDT 4-hour chart
Further supporting this downswing thesis is the drop in daily active addresses from 691,650 on May 15 to 502,450 today. This 27% decline indicates that investors are fleeing the market.
 daa-637593433927708290.png)
ETH daily active addresses chart
The sentiment becomes apparent when considering the fees to transact on the Ethereum blockchain plummeted from $23.64 on May 15 to $3.85, an 83% drop.
Despite the massive decline in gas fees, the daily active addresses are not showing signs of growth, indicating that the users are hesitant about Ethereum’s performance.
 fees-637593434138843582.png)
ETH average fees chart
On the other hand, there is a chance this bearish formation might come undone if the recently flipped support level at $2,552 holds. If this were to happen, ETH might consolidate in this range while preparing for a move higher.
The resistance level at $2,847 and the range high at $2,909 are two levels that the bulls might target.
Ripple price lacks momentum but could generate it shortly
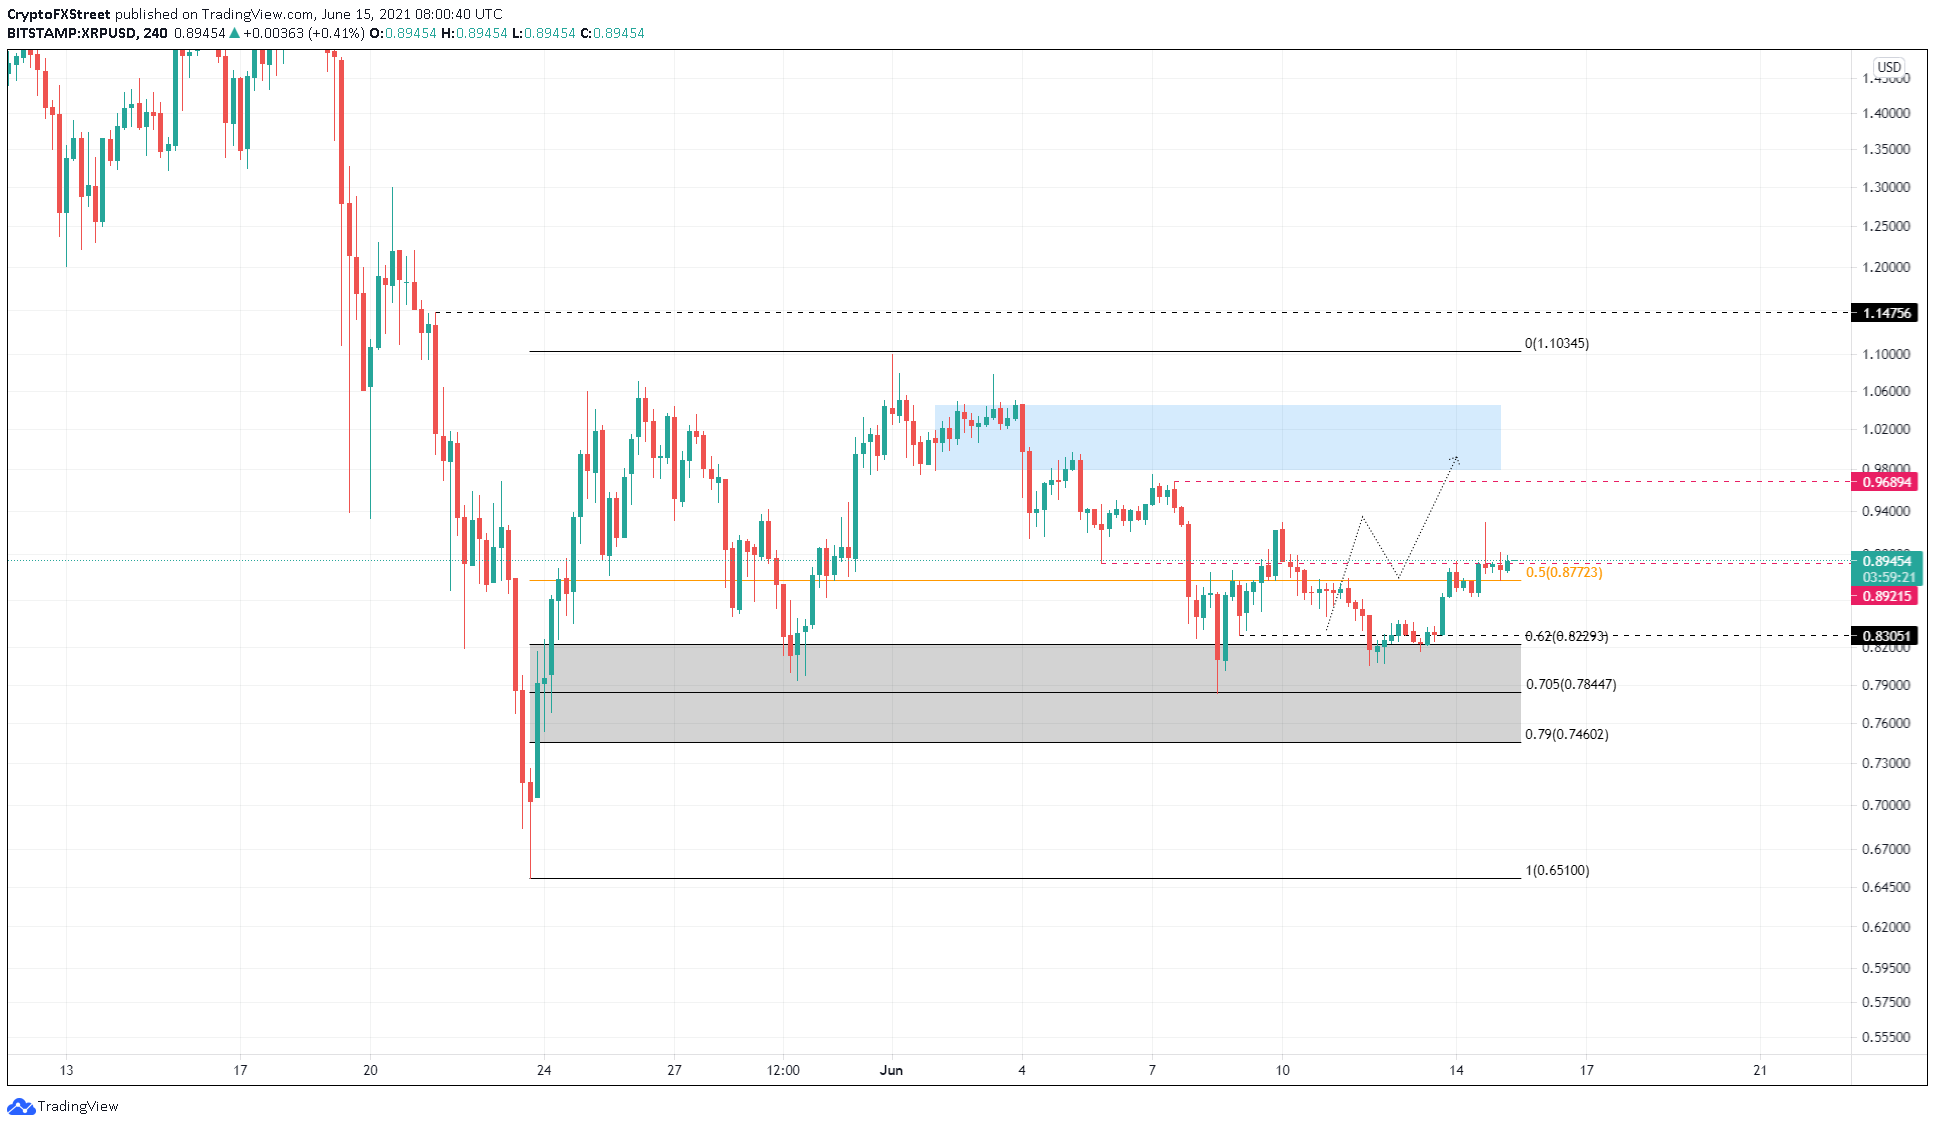
Ripple price performance is similar to Ethereum price. However, unlike the smart contract token, XRP price is sitting above the 50% Fibonacci retracement level at $0.877.
The said barrier could play a pivotal role in kick-starting a new uptrend for the remittance token. A decisive 4-hour candlestick close above the resistance barrier at $0.892, which is in proximity to the mid-way point of the range, will signal the start of an uptrend.
If this were to happen, XRP price could rise 10% to tag the demand zone extending from $0.979 to $1.045.
Under particular circumstances, the remittance token might tag the range high at $1.104 and $1.148.
XRP/USDT 4-hour chart
Regardless of the support levels, a breakdown of the 79% Fibonacci retracement level at $0.746 will invalidate the upswing. In this case, XRP price could retrace 12% to tag the range low at $0.651.
Author

Akash Girimath
FXStreet
Akash Girimath is a Mechanical Engineer interested in the chaos of the financial markets. Trying to make sense of this convoluted yet fascinating space, he switched his engineering job to become a crypto reporter and analyst.



