Top 3 Price Prediction Bitcoin, Ethereum, Ripple: Elon Musk energizes BTC bullish thesis, with ETH and XRP range-bound
- Bitcoin price streaks towards imposing resistance between $41,581 and $44,622.
- Ethereum price rebounds from symmetrical triangle's lower trend line, but on weak volume numbers.
- XRP price has notably decoupled from Bitcoin, showing no meaningful price direction since the June 8 low.

Bitcoin price buoyed again by an unusual tweet from Elon Musk, lifting the bellwether cryptocurrency beyond the highs established by the El Salvador legal tender news. Ethereum price inches toward the London hard fork with passive price action and weak correlation with the Bitcoin advance. XRP price remains locked in a tight trading range with explicit support at $0.76-$0.78.
Bitcoin price rally lacking a sustained rise in social volume
With the tool of Twitter, Elon Musk triggered a 10% spike in Bitcoin price, indicating that if the renewal energy used for the Bitcoin network exceeded 50%, he would consider allowing bitcoin transactions again. It was the necessary catalyst to release BTC from a long-standing symmetrical triangle originating back in mid-May.
The unexpected spike has catapulted Bitcoin price near the omnipresent resistance layered between $41,581 and $44,622. The range is defined by the 38.2% retracement level of the rally from the March 2020 low at $41,581, the January high of $41,986, the 200-day simple moving average (SMA) at $42,371, the February low of $43,016, the 38.2% retracement of the April-May correction at $43,331, and finally, the 50-day SMA at $44,619.
The resistance will prove formidable, and the concerning lack of volume underpinning the bounce from the bullish hammer candlestick pattern on June 8 may portend a few stumbles. Moreover, the upcoming death cross, when the 50-day SMA crosses below the 200-day SMA, could provide further downside pressure.
The BTC death cross in March 2020 coincided with a swing high and was followed by a minor pullback before the rally resumed. However, the death cross in October 2019 was followed by a 35% decline. So, the death cross does not guarantee a significant drop, but it is essential to consider this scenario.
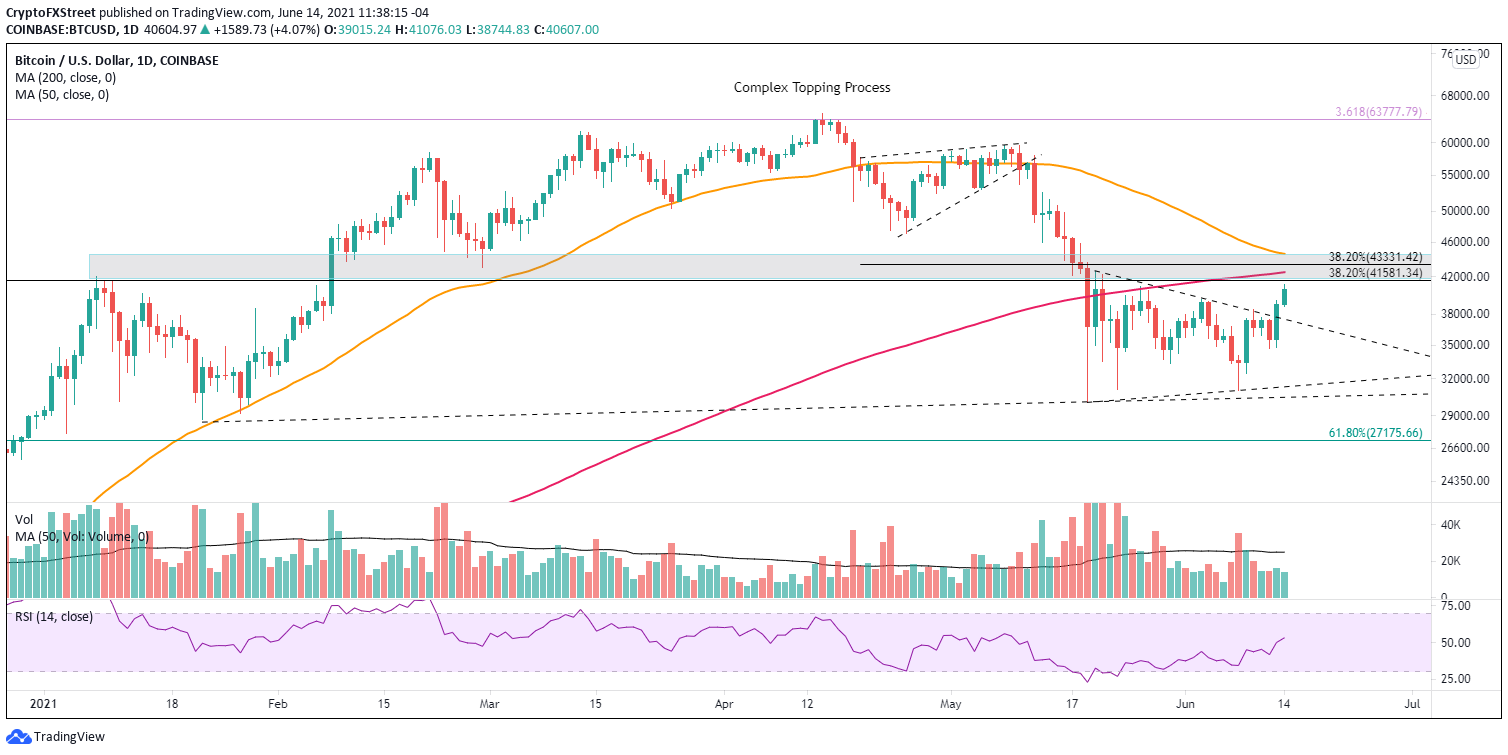
BTC/USD daily chart
First and foremost, Bitcoin price needs to a daily close above the 50-day SMA at $44,618 to firmly place BTC on the path to chase the all-time high of $64,899. It would represent a gain of just over 10% from the current price and likely one of the most challenging 10% gains for the flagship cryptocurrency.
On the whole, Bitcoin’s social volume data indicated a strong crowd reaction to the El Salvador news, which many hyped as the turning point for Bitcoin price fortunes moving forward. Yet, the excitement did not last long, with social volume dropping sharply into June 12, taking it to the lowest levels since April.
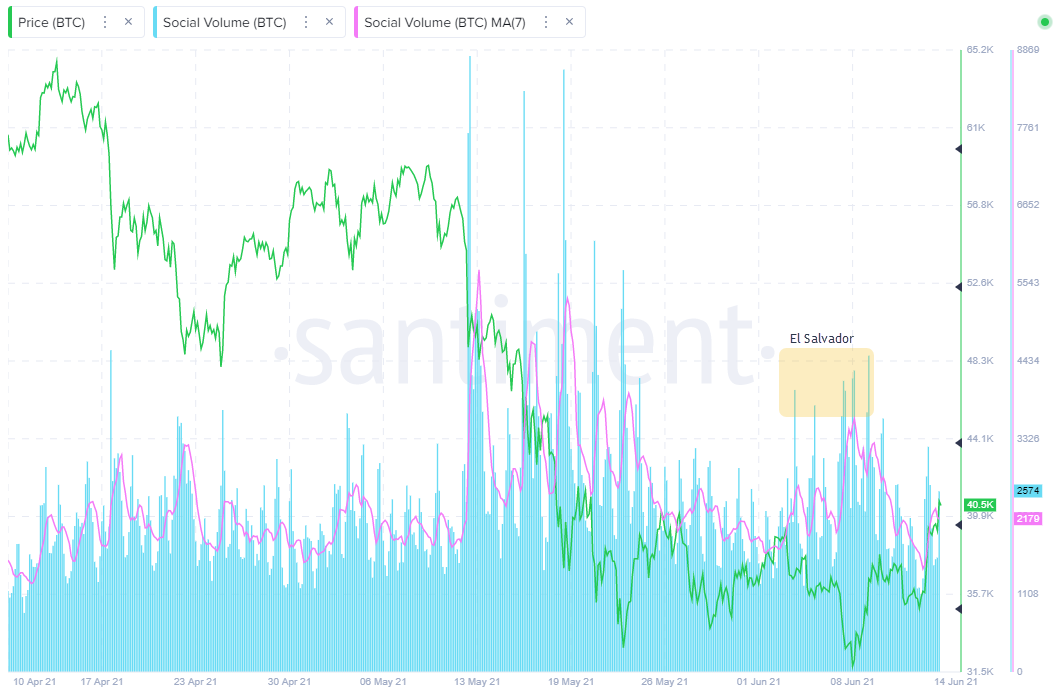
BTC Social Volume - Santiment
Musk’s tweet was matched by renewed social volume but well below the levels reached on the El Salvador news. To be sure, sentiment is a secondary indicator; however, the Bitcoin price battle with the upcoming resistance would be well-served by a new intensity in social volume.
Ethereum price shifts from bear pennant to a symmetrical triangle
Until yesterday, Ethereum price had been forming a bear pennant formation on the charts. Still, it has now moved into its fourth week of duration, transitioning it to a symmetrical triangle. More specifically, pennants are shorter duration patterns and should not last more than three weeks.
The London hard fork update is only a couple of weeks away. It is projected that the hard fork will be successful, making Ethereum more attractive as a store of value, thereby permitting the digital asset to expand its target market.
Nevertheless, the current governing technical pattern and the pronounced underperformance versus Bitcoin as measured by the correlation coefficient implies that the hard fork may experience some glitches or setbacks. Moreover, the symmetrical triangle still presents the possibility of a 40% decline if the pattern resolves to the downside, placing Ethereum price near the 40-week SMA at $1,468 and the 2018 high of $1,419.
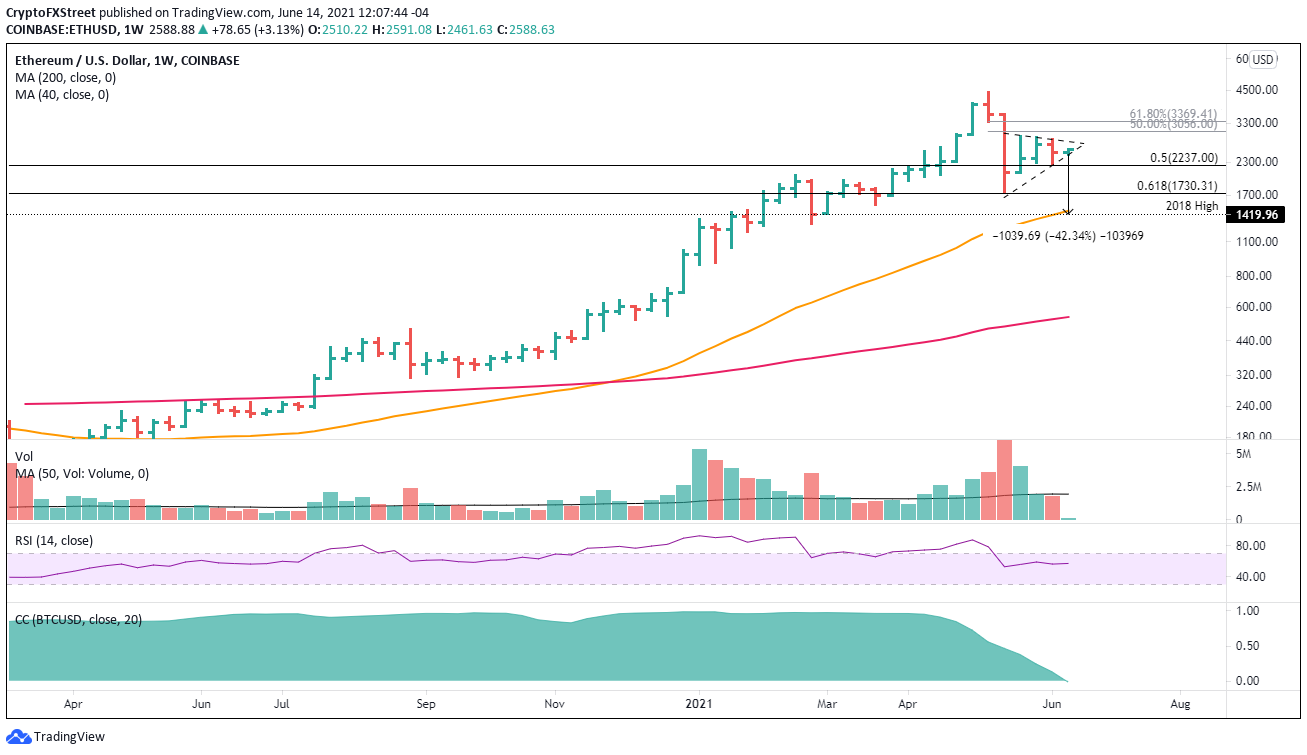
ETH/USD weekly chart
Ethereum price is nearing the apex of the symmetrical triangle, suggesting that a breakout or breakdown is coming soon. Still, due to the closeness of ETH to the apex, the resolution may lack impulsiveness.
An upside resolution will encounter resistance at the 50% retracement of the May correction at $3,056 and then the 61.8% retracement at $3,369.
If the rally takes on impulsive price action, Ethereum price could reach the measured move target of the symmetrical triangle at $3,970.
XRP price range keeps investors in a state of suspense
XRP price had been marching lower after triggering the bear flag on June 3, without the impulsiveness often characteristic of such patterns. Yesterday’s 10% rally in Bitcoin did offer a springboard for Ripple, carrying it to the 50 twelve-hour SMA.
Beginning after the May 23 low at the 200-day SMA, XRP price has defended the critical price range framed by the November 2020 high at $0.78 and the neckline of a multi-year inverse head-and-shoulders pattern at $0.760. The neckline runs from the September 2018 high of $0.791 through the November 2020 high of $0.780. The XRP price pattern was activated on April 5 with an explosive one-day gain of 44%.
On the upside, the price range between the psychologically important $1 and the 38.2% Fibonacci retracement of the April-May correction at $1.145 has contained the rebounds since May 23, thus forming a convenient and actionable trading range for keen Ripple swing traders.
The measured move of the bear flag pattern, determined by the percentage length of the flagpole, is approximately 55%, establishing $0.422 as the target. Thus, at $0.422, XRP price will have declined almost 80% from the April high of $1.96, thereby canceling the ambitious forecasts of a test of the all-time high of $3.30 in 2021.
A daily close below $0.760 will dictate a rethink of the trading range outlook favoring a more bearish outlook that includes at least a sweep of the May 23 low of $0.652.
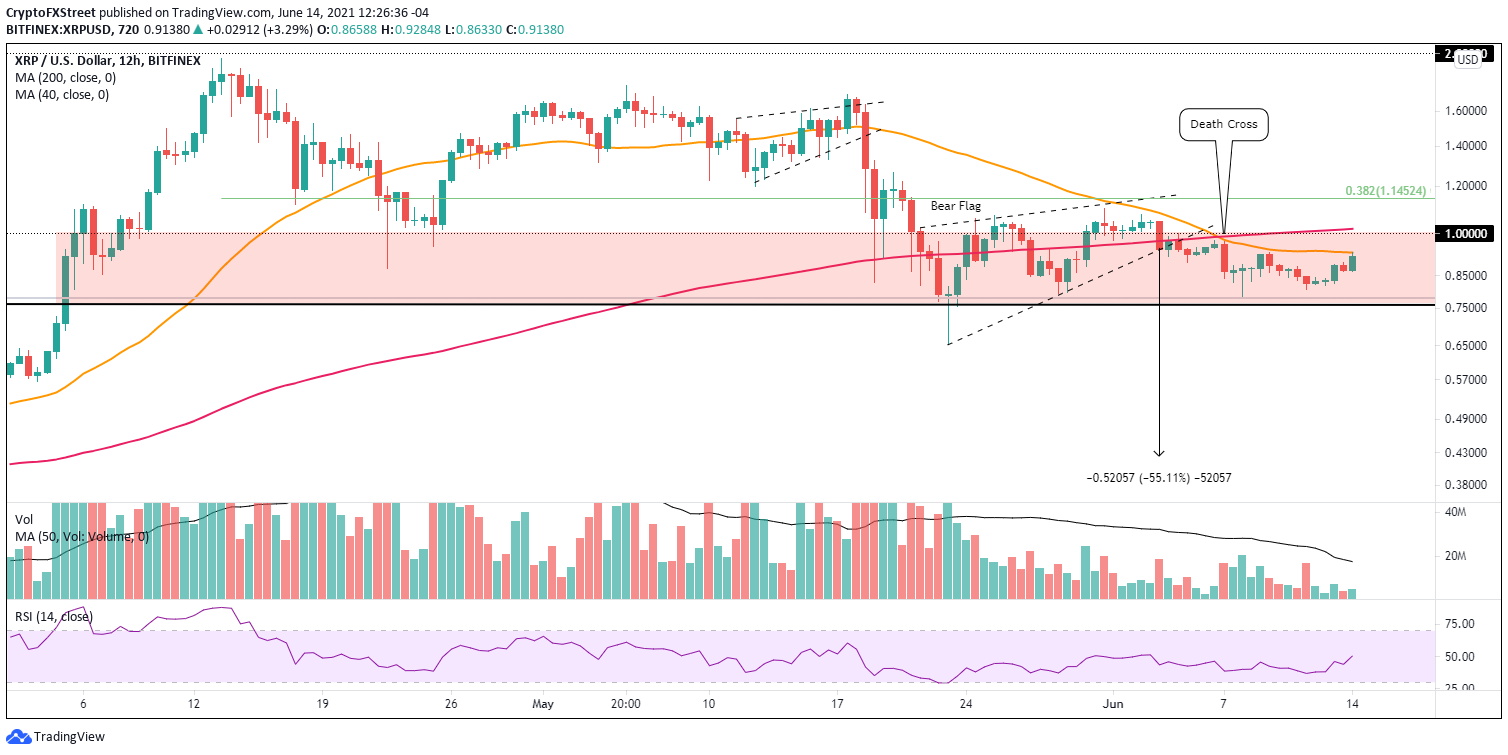
XRP/USD 12-hour chart
On the upside, XRP price would need to begin with a daily close above $1 and the 200 twelve-hour SMA at $1.018 before engaging a bullish outlook. A bullish view would be confirmed by a daily close above the 38.2% retracement at $1.145. It would be a 25% gain from the current price, but investors should be patient without entries near outstanding support.
Author

Sheldon McIntyre, CMT
Independent Analyst
Sheldon has 24 years of investment experience holding various positions in companies based in the United States and Chile. His core competencies include BRIC and G-10 equity markets, swing and position trading and technical analysis.


