Four reasons why XRP price could set new-all time high above $5
- XRP price is forming an inverse head-and-shoulders pattern, which projects a 603% rally to $5.53.
- Social volume for the remittance token has hit 42, a level last seen in early April before the start of the bull run.
- Supply distribution shows that whales have been on an accumulation spree regardless of the recent sell-off.

XRP price experienced a significant bull run as it rallied roughly 750% since 2021. However, due to the recent correction, Ripple’s year-to-date (YTD) performance is hovering around 268%.
Despite this sell-off, the remittance token might be setting the stage for another bull run, comparable to the first run-up of 2021.
XRP price hovers above crucial support level
XRP price has formed a multi-month bottom reversal pattern known as inverse head-and-shoulders. This pattern contains three swing lows, with the ones in the extreme of comparable depths known as the shoulders and the central valley, known as the head.
The peaks of these swing lows can be connected via a horizontal trend line at $0.779, forming a neckline.
This setup forecasts a 608% upswing to $5.53, determined by adding the distance between the swing low of the head and the neckline to the breakout point at $0.779.
XRP price broke out of the neckline on April 6 and rallied nearly 150%. However, the slowdown of the cryptocurrency bull run and the sell-off that ensued after it in May has undone these gains.
Ripple is currently trading at $0.877 after a brief dip below the neckline at $0.779. Typically a retest of the neckline after a breakout makes the bullish case for the technical formation and provides an opportunity for the sidelined investors who missed the initial run-up.
Therefore, increased buying pressure could restart a 608% bull rally that shatters the all-time high from 2018 at $3.30 and set up a new one at $5.53.
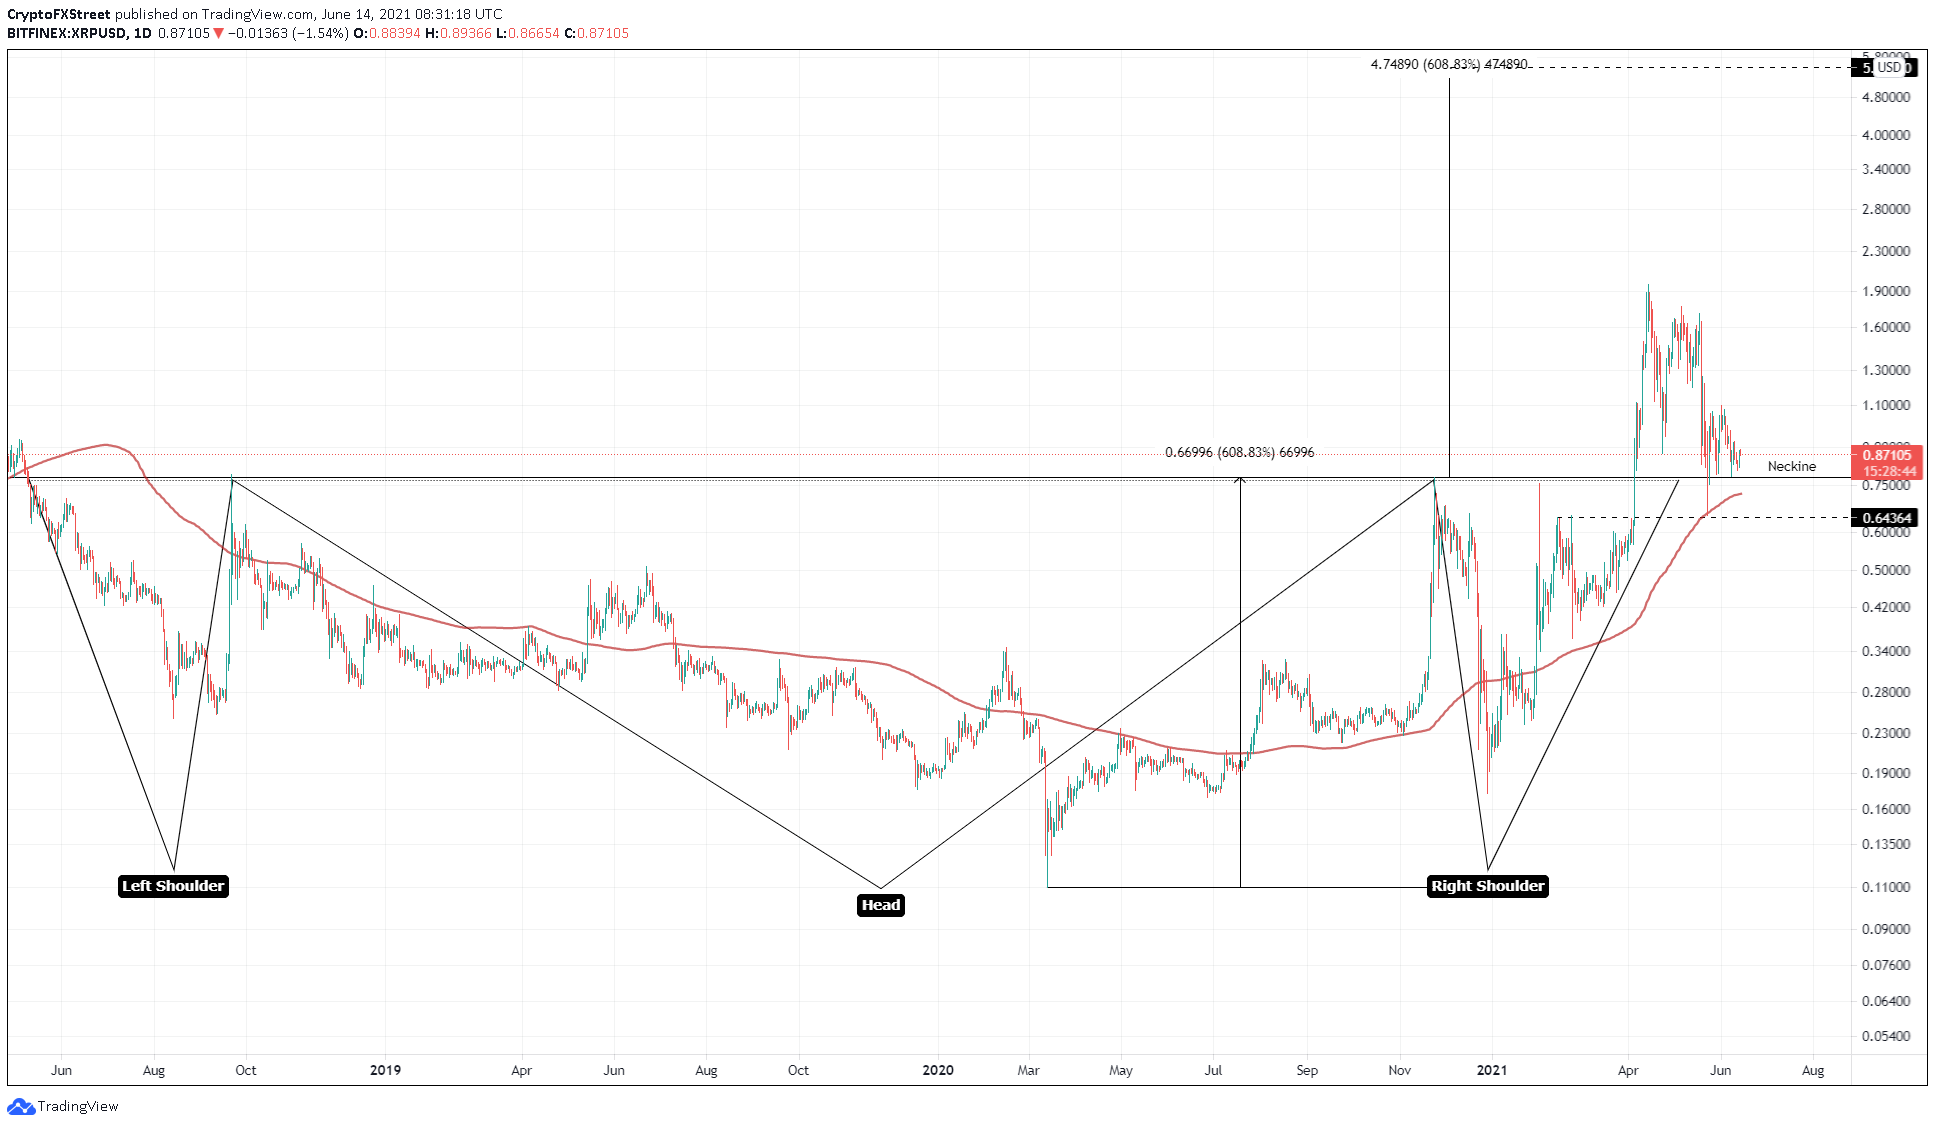
XRP/USD 1-day chart
The supply distribution on-chain metric shows significant support for this bullish hypothesis, as it reveals whales’ accumulation spree.
Since the initial peak on April 7, investors holding between 1,000 to 1,000,000 XRP have increased from roughly 396,000 to 442,000. The addition of 46,000 new users to this category indicates that these market participants are interested in XRP at the current price levels and provide a proxy to their investment thesis, which shows a bullish bias.
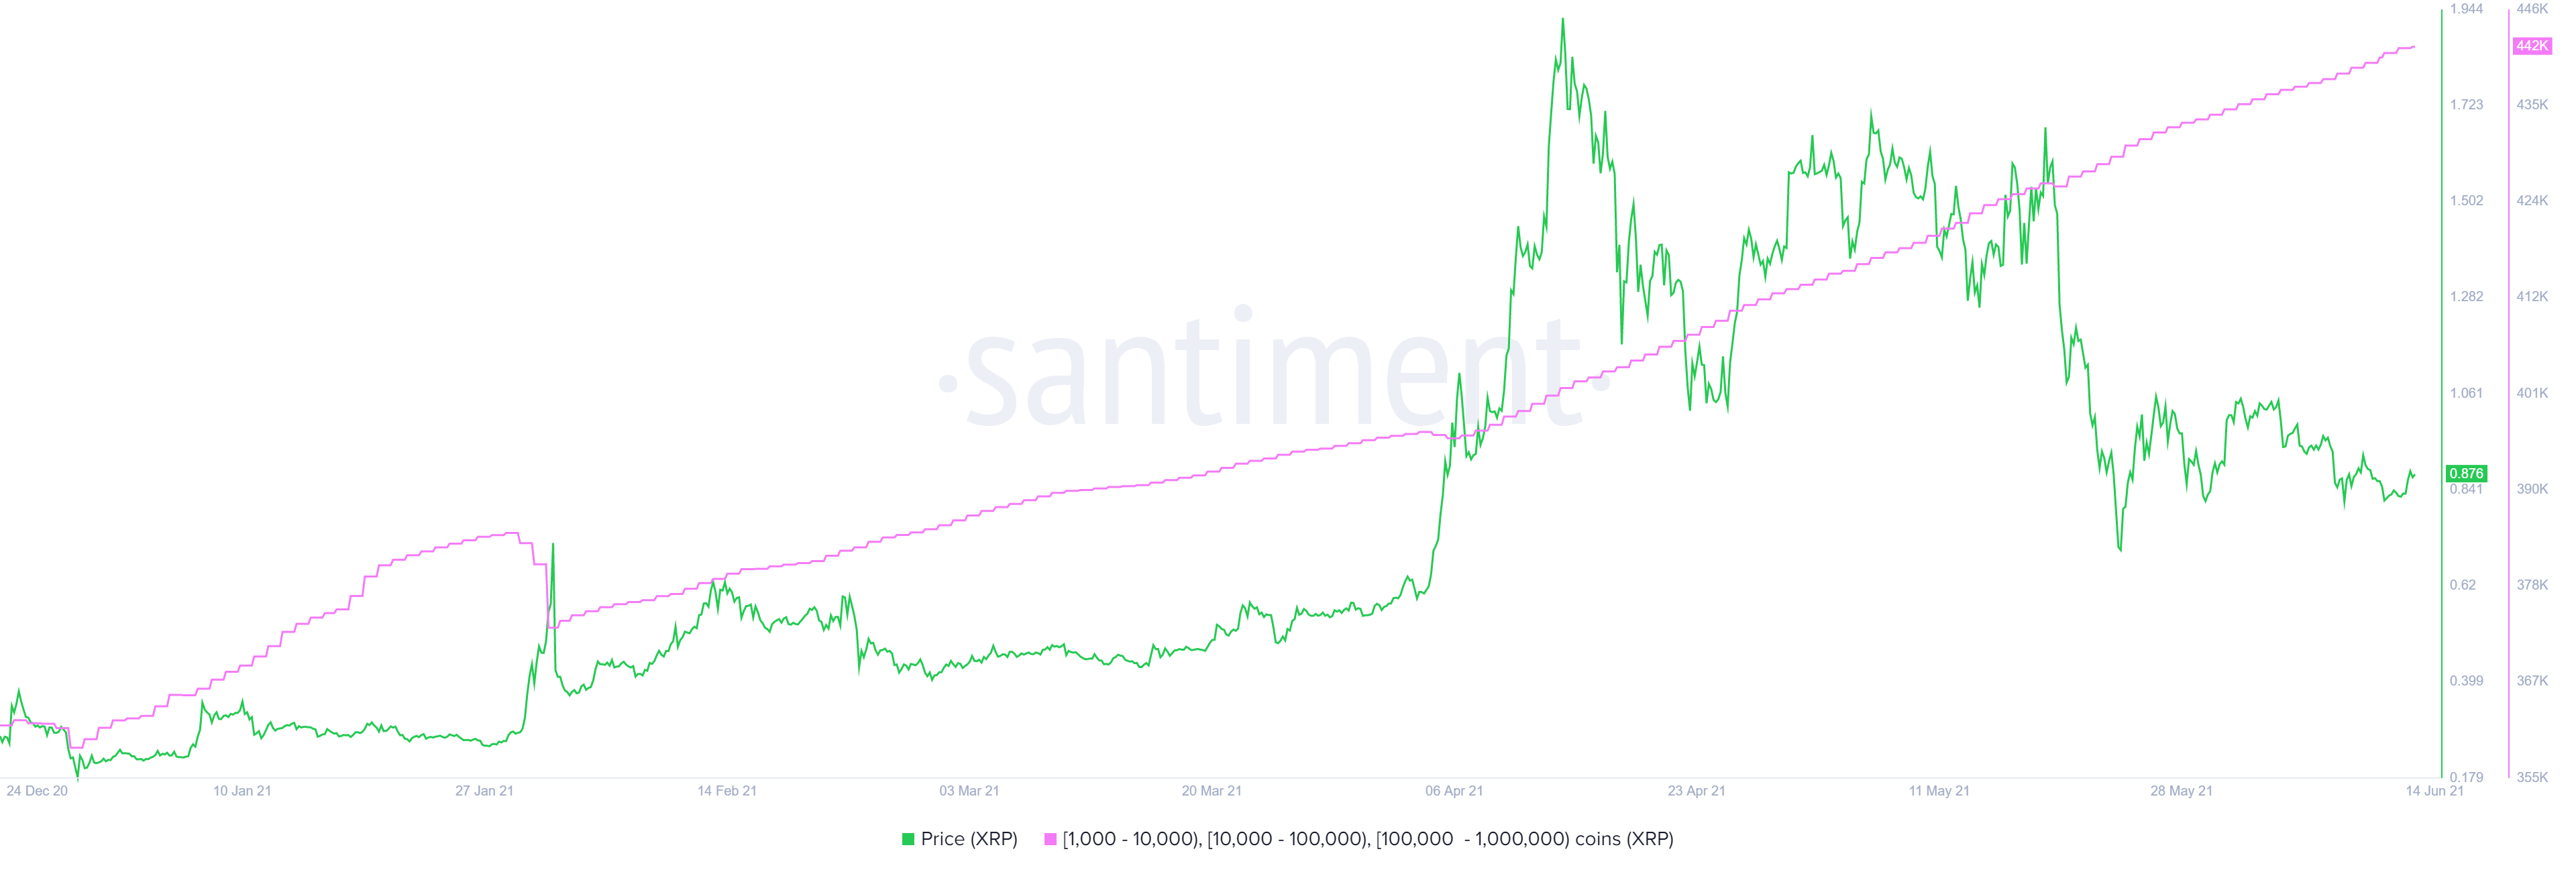
XRP supply distribution chart
The second most important metric shows that XRP price might be due for a massive spike is the social volume. From a counter-sentiment perspective, a massive uptick in this metric paints substantial retail FOMO and often marks local tops.
The social volume for Ripple is currently hovering around 62, a level last seen in early April, before the start of a 200+% bull run. Therefore, a 608% projection from the multi-year head-and-shoulders pattern would make sense if something similar were to happen.
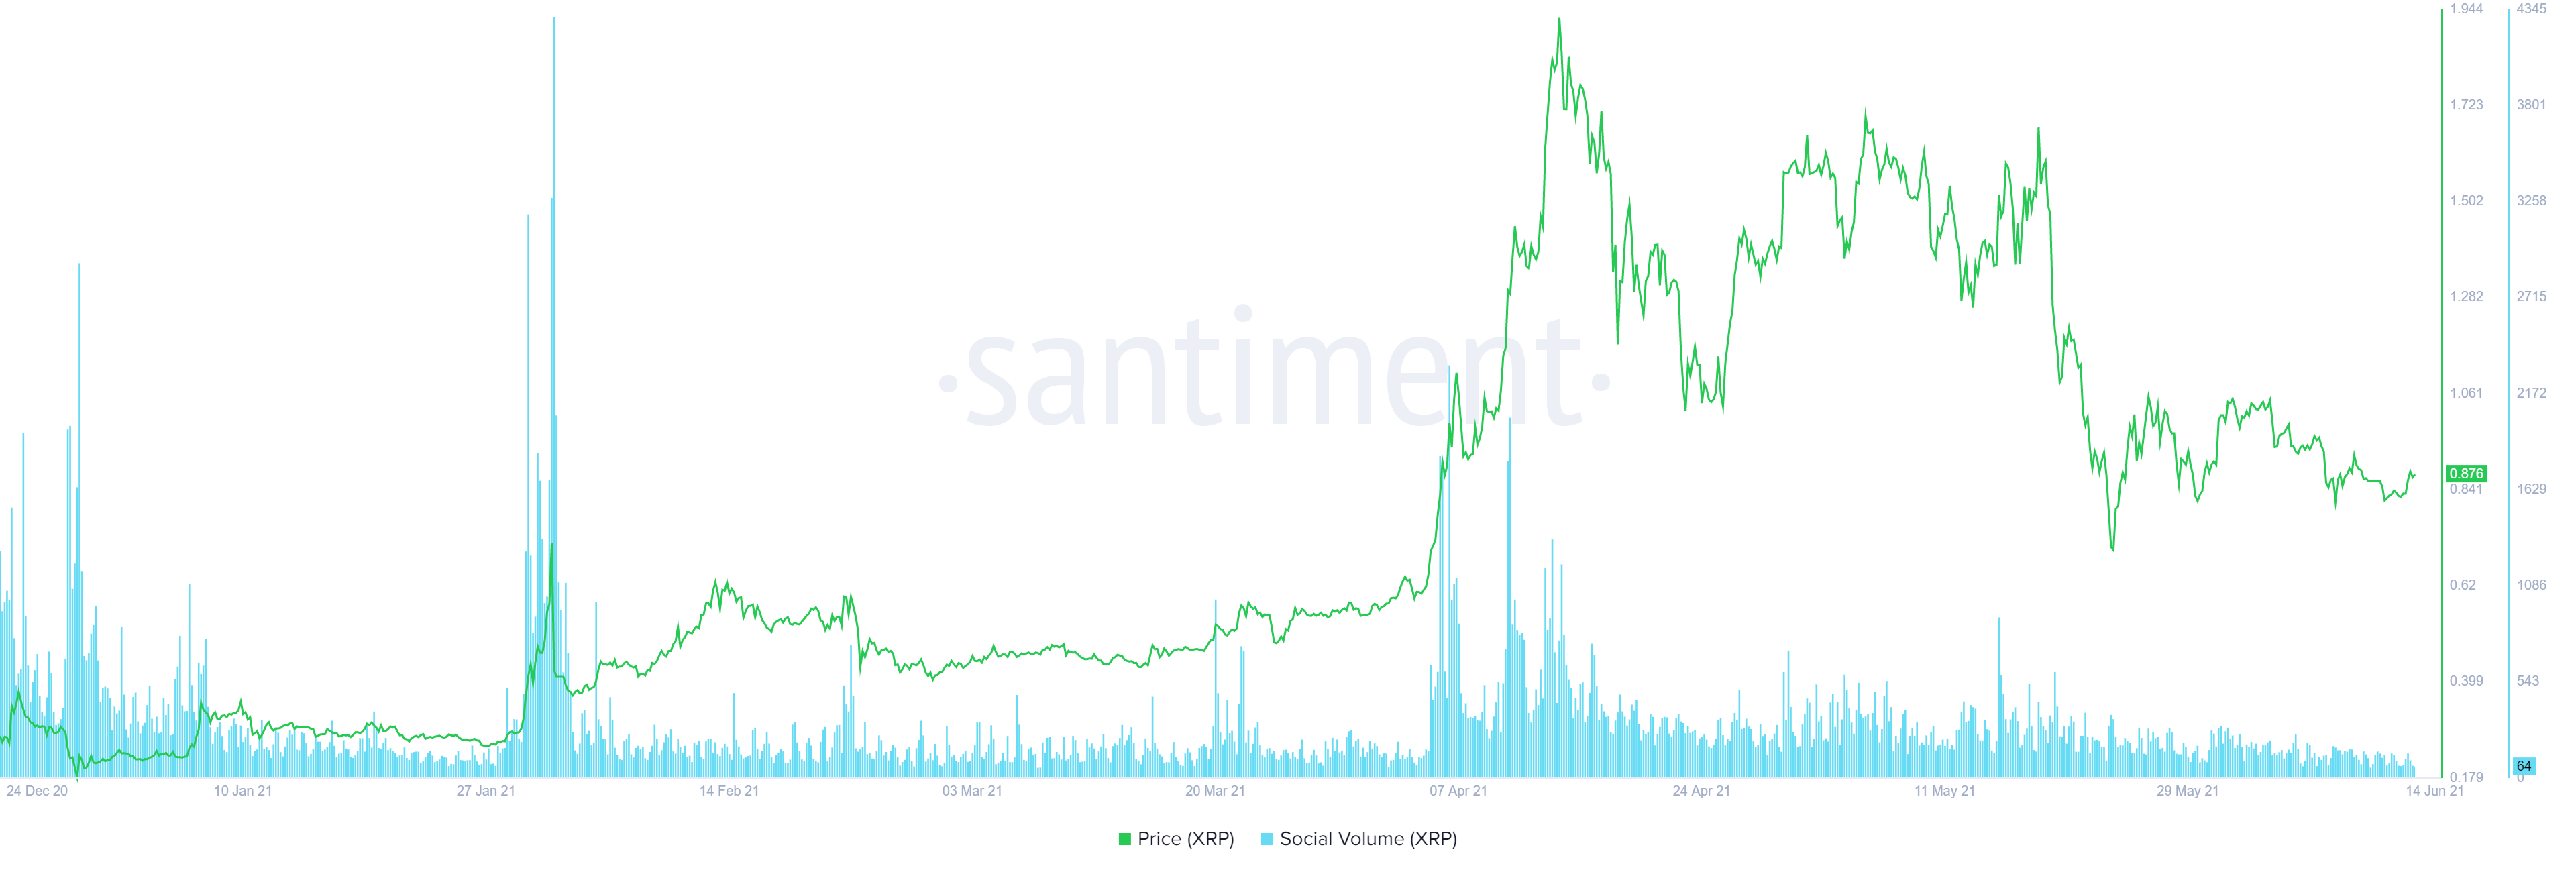
XRP social volume chart
Even the 365-day Market Value to Realized Value (MVRV) model adds a tailwind to the bullish thesis explained above. This fundamental index measures the profit/loss of investors who purchased XRP over the past year.
A high MVRV value reveals that most of the market participants are in profit, indicating that a potential sell-off might occur if these investors were to realize their gains.
Considering the recent plummet of the 365-day MVRV for XRP, it is unlikely there will be a brutal sell-off that breaks below the neckline at $0.779.
However, there is a tiny chance that XRP price might drop in the coming days, pushing the MVRV into an opportunity zone below 10% and allowing long-term holders to accumulate.
This phase is likely to kick-start the said bull run.
 [14.02.37, 14 Jun, 2021]-637592591146605754.png)
XRP 365-day MVRV chart
All in all, XRP price looks primed for a bull run but awaits a catalyst to trigger it. If the said impetus fails to arrive and the bears take over, pushing XRP price below $0.779, it will put a dent in the bullish thesis.
However, a decisive daily candlestick close below the 200-day Simple Moving Average at $0.72 will invalidate the optimistic scenario and kick-start a bearish one that might push XRP price as low as $0.644.
Author

Akash Girimath
FXStreet
Akash Girimath is a Mechanical Engineer interested in the chaos of the financial markets. Trying to make sense of this convoluted yet fascinating space, he switched his engineering job to become a crypto reporter and analyst.




