Top 3 Price Prediction Bitcoin, Ethereum, Ripple: BTC edges closer to recovery after sweeping Monday's low
- Bitcoin price attempts to overcome the $30,711 hurdle after a 26% run-up.
- Ethereum price looks primed for a breakout that could trigger a minimum rally of 21% to $2,439.
- Ripple price continues to bounce between the $0.548 and $0.413 barriers, awaiting a breakout.

Bitcoin (BTC) price seems to be edging closer to ending its ongoing sideways movement. This development comes after BTC swept this week's lows, suggesting that a potential rally in the opposite direction is likely not just for the big crypto but also for Ethereum (ETH), Ripple (XRP) and other altcoins.
Read more: Coinbase slams SEC in new filing, argues regulator has no jurisdiction over cryptocurrencies on the exchange
Bitcoin price at inflection point
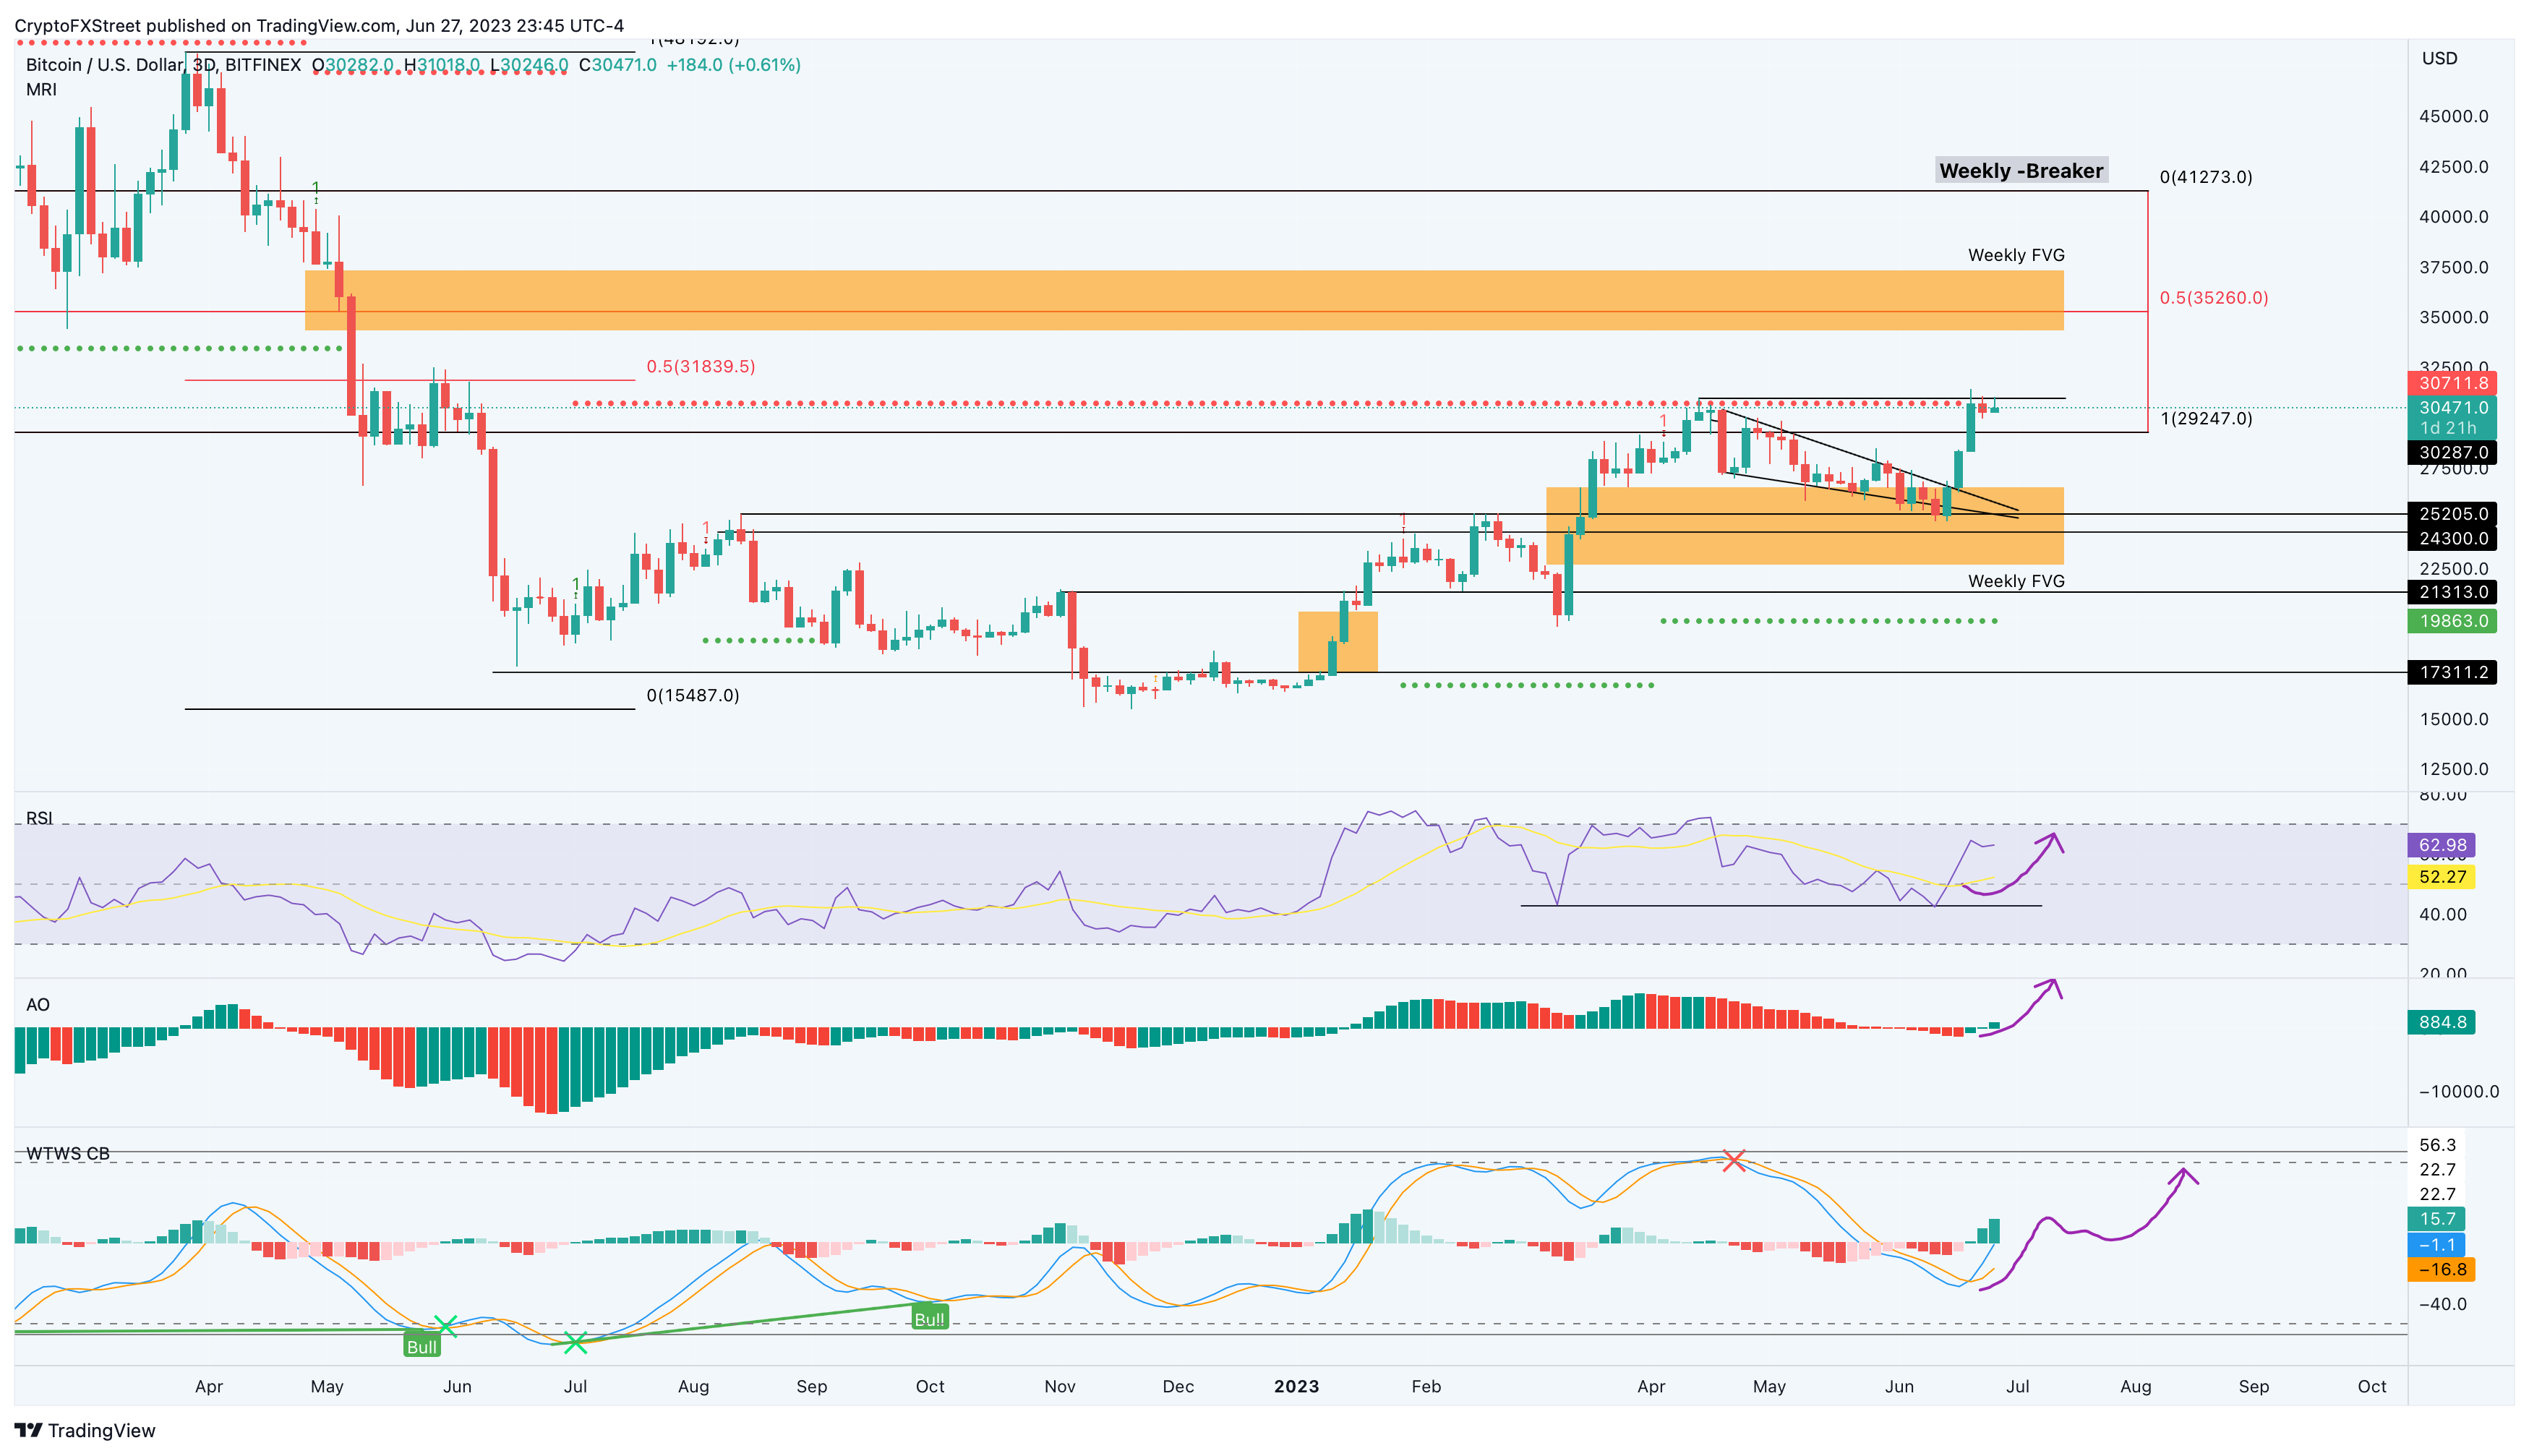
Bitcoin (BTC) price remains still after its 26% ascent since June 15. After its recent uptick, BTC has set up a new high at $31,430 after taking out the previous local top at $30,968. The Relative Strength Index (RSI) has flipped above the mean line at 50, and the Awesome Oscillator (AO) has produced a green histogram bar above the zero line. This development is a clear sign that bullish momentum is on the rise.
Therefore, a decisive three-day candlestick close above the Momentum Reversal Indicator’s (MRI) State Trend Resistance level at $30,711 will be a buy signal. A move after this flip will allow Bitcoin price to target the weekly Bearish Breaker’s midpoint at $35,260.
Although unlikely, if the bullish momentum continues to remain dominant, Bitcoin price could attempt a retest of the Bearish Breaker’s upper limit at $41,273.
BTC/USDT 3-day chart
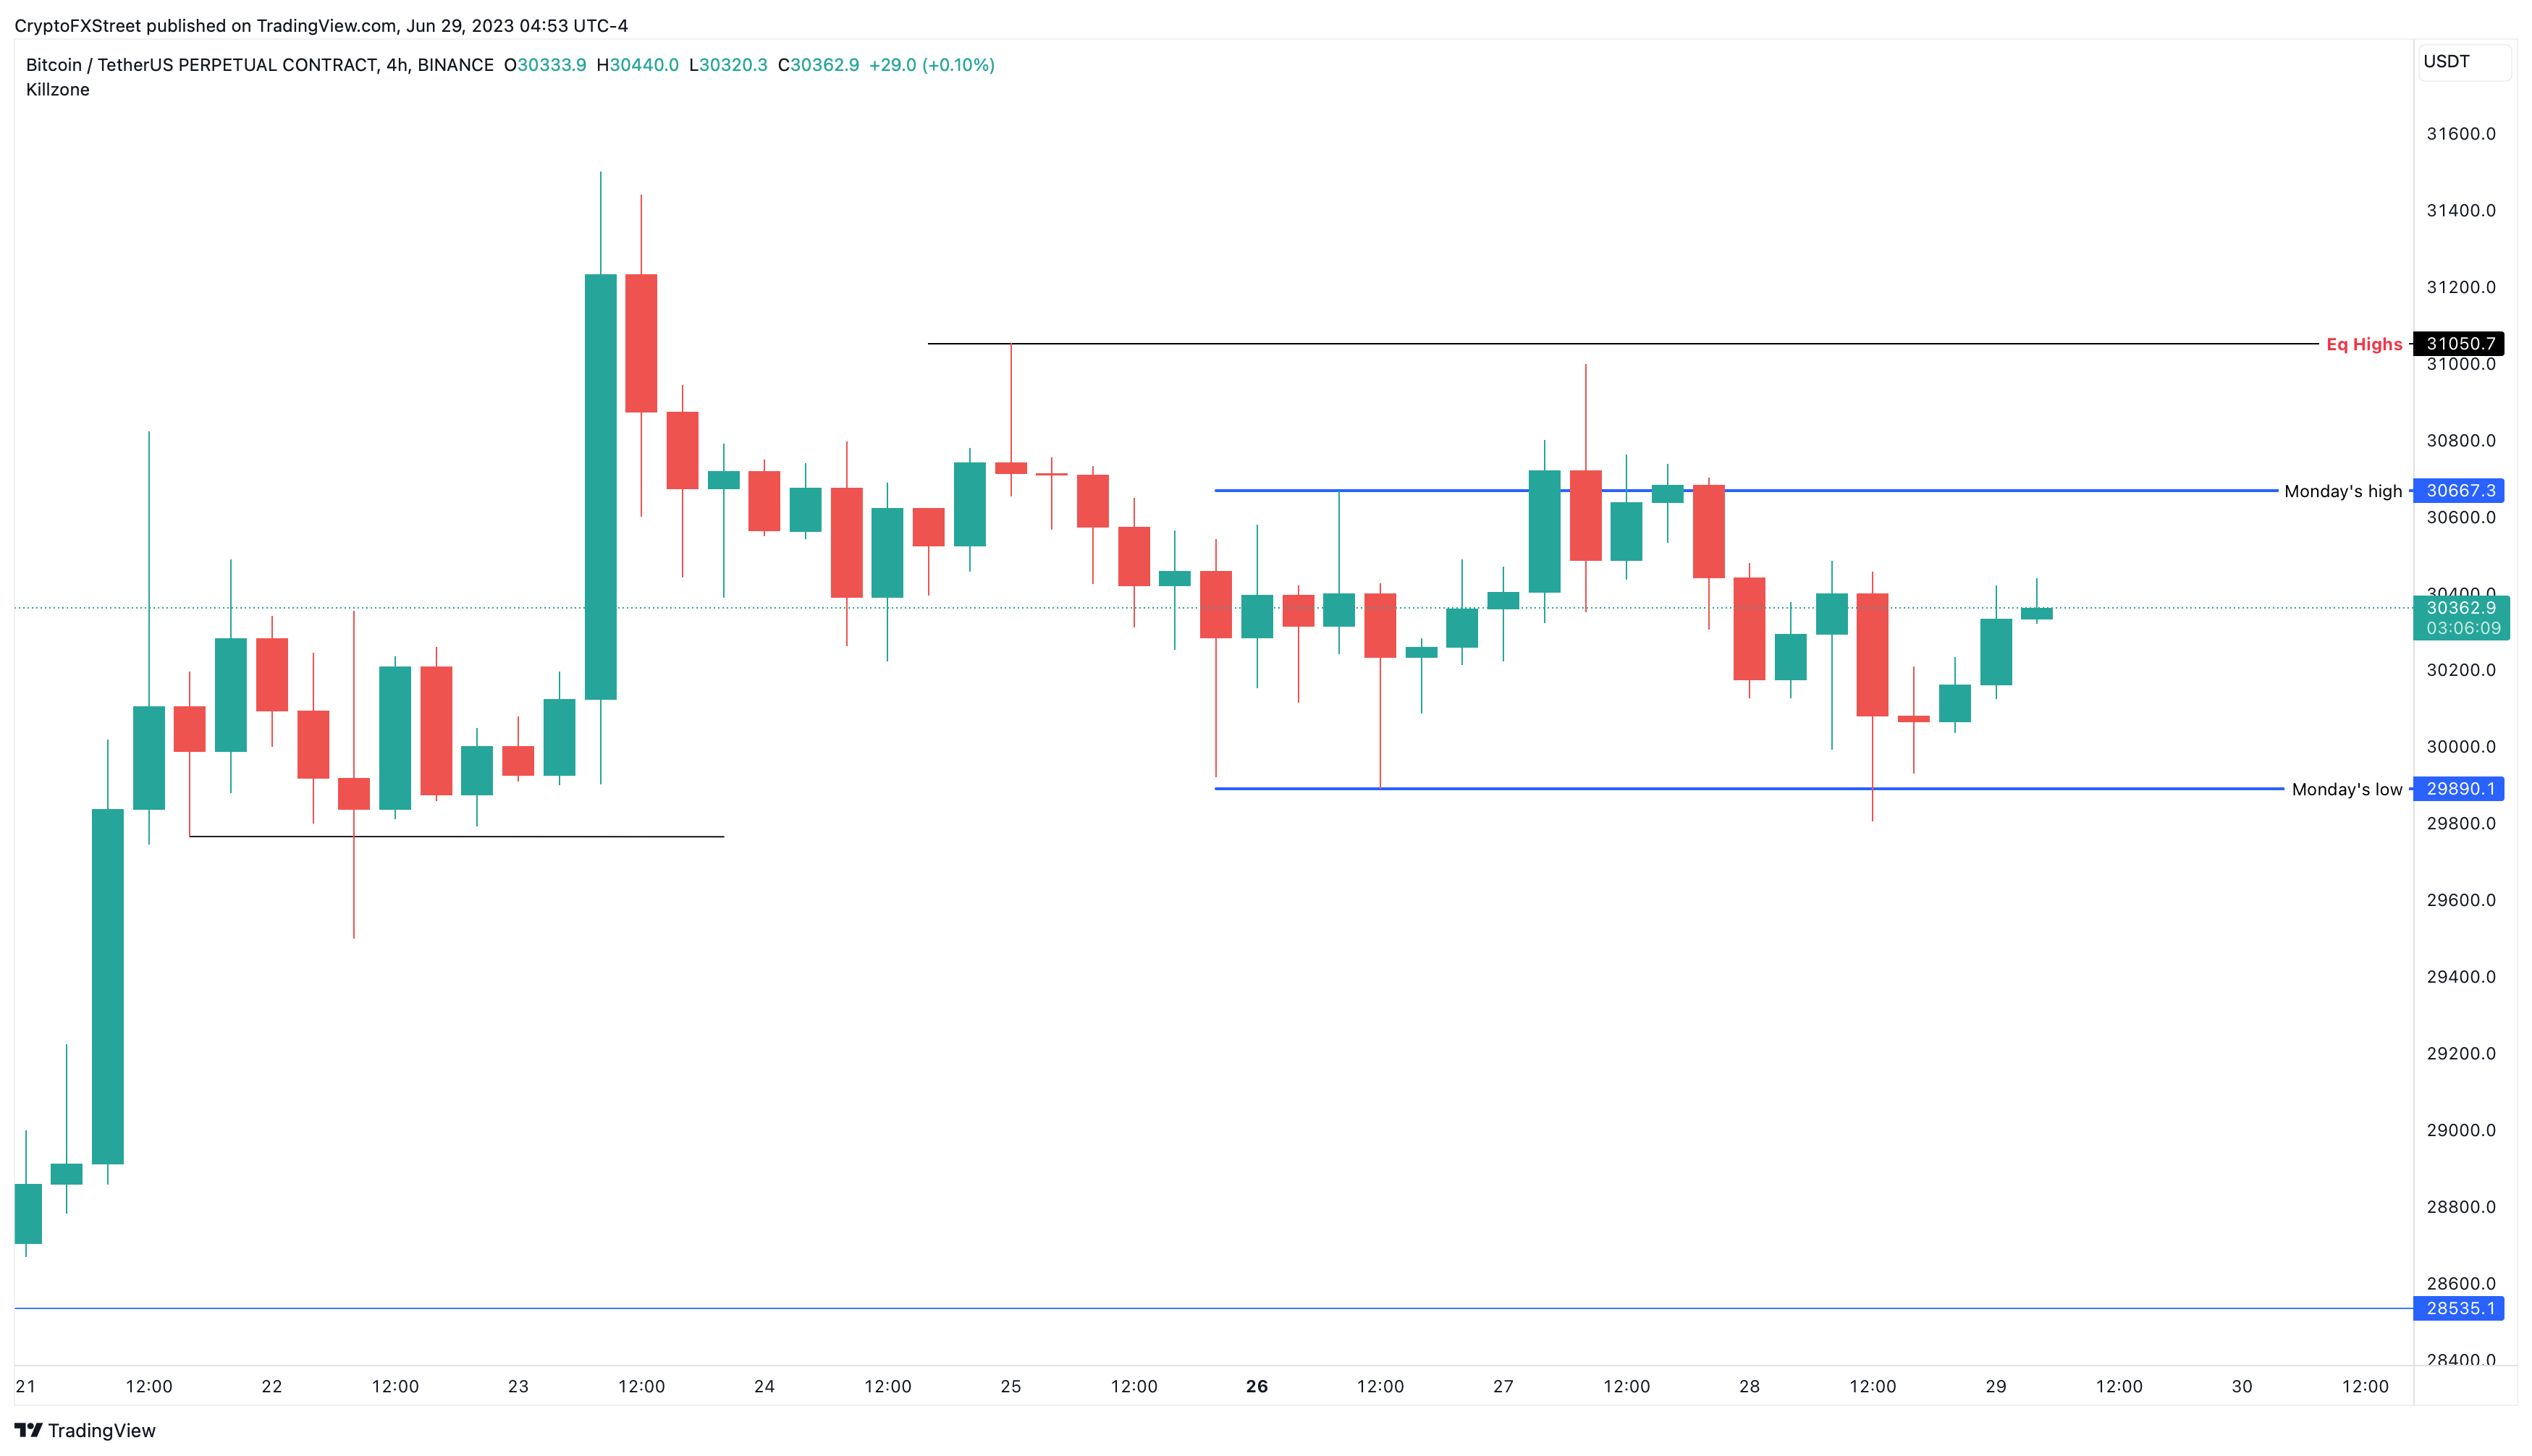
Additionally, the lower timeframe chart, as seen below, shows a much more nuanced outlook for Bitcoin price. On June 28, BTC swept Monday''s low at $29,890. The intention of this move was to collect the sell-side liquidity, which often signals a move in the opposite direction. Therefore, the next short-term target for Bitcoin price could be the equal highs at $31,050 followed by the June 23 swing high at $31,500.
BTC/USDT 4-hour chart
The bullish outlook for Bitcoin price makes sense considering the momentum indicators, but investors need to take a closer look at the RSI. While BTC has produced three higher highs since January, RSI has produced three lower highs. This setup is termed “bearish divergence” and often results in correction of the underlying asset.
Also read: Bitcoin holds above $30k as investors await historically strong July, eye options expiry
Ethereum price awaits buy signal
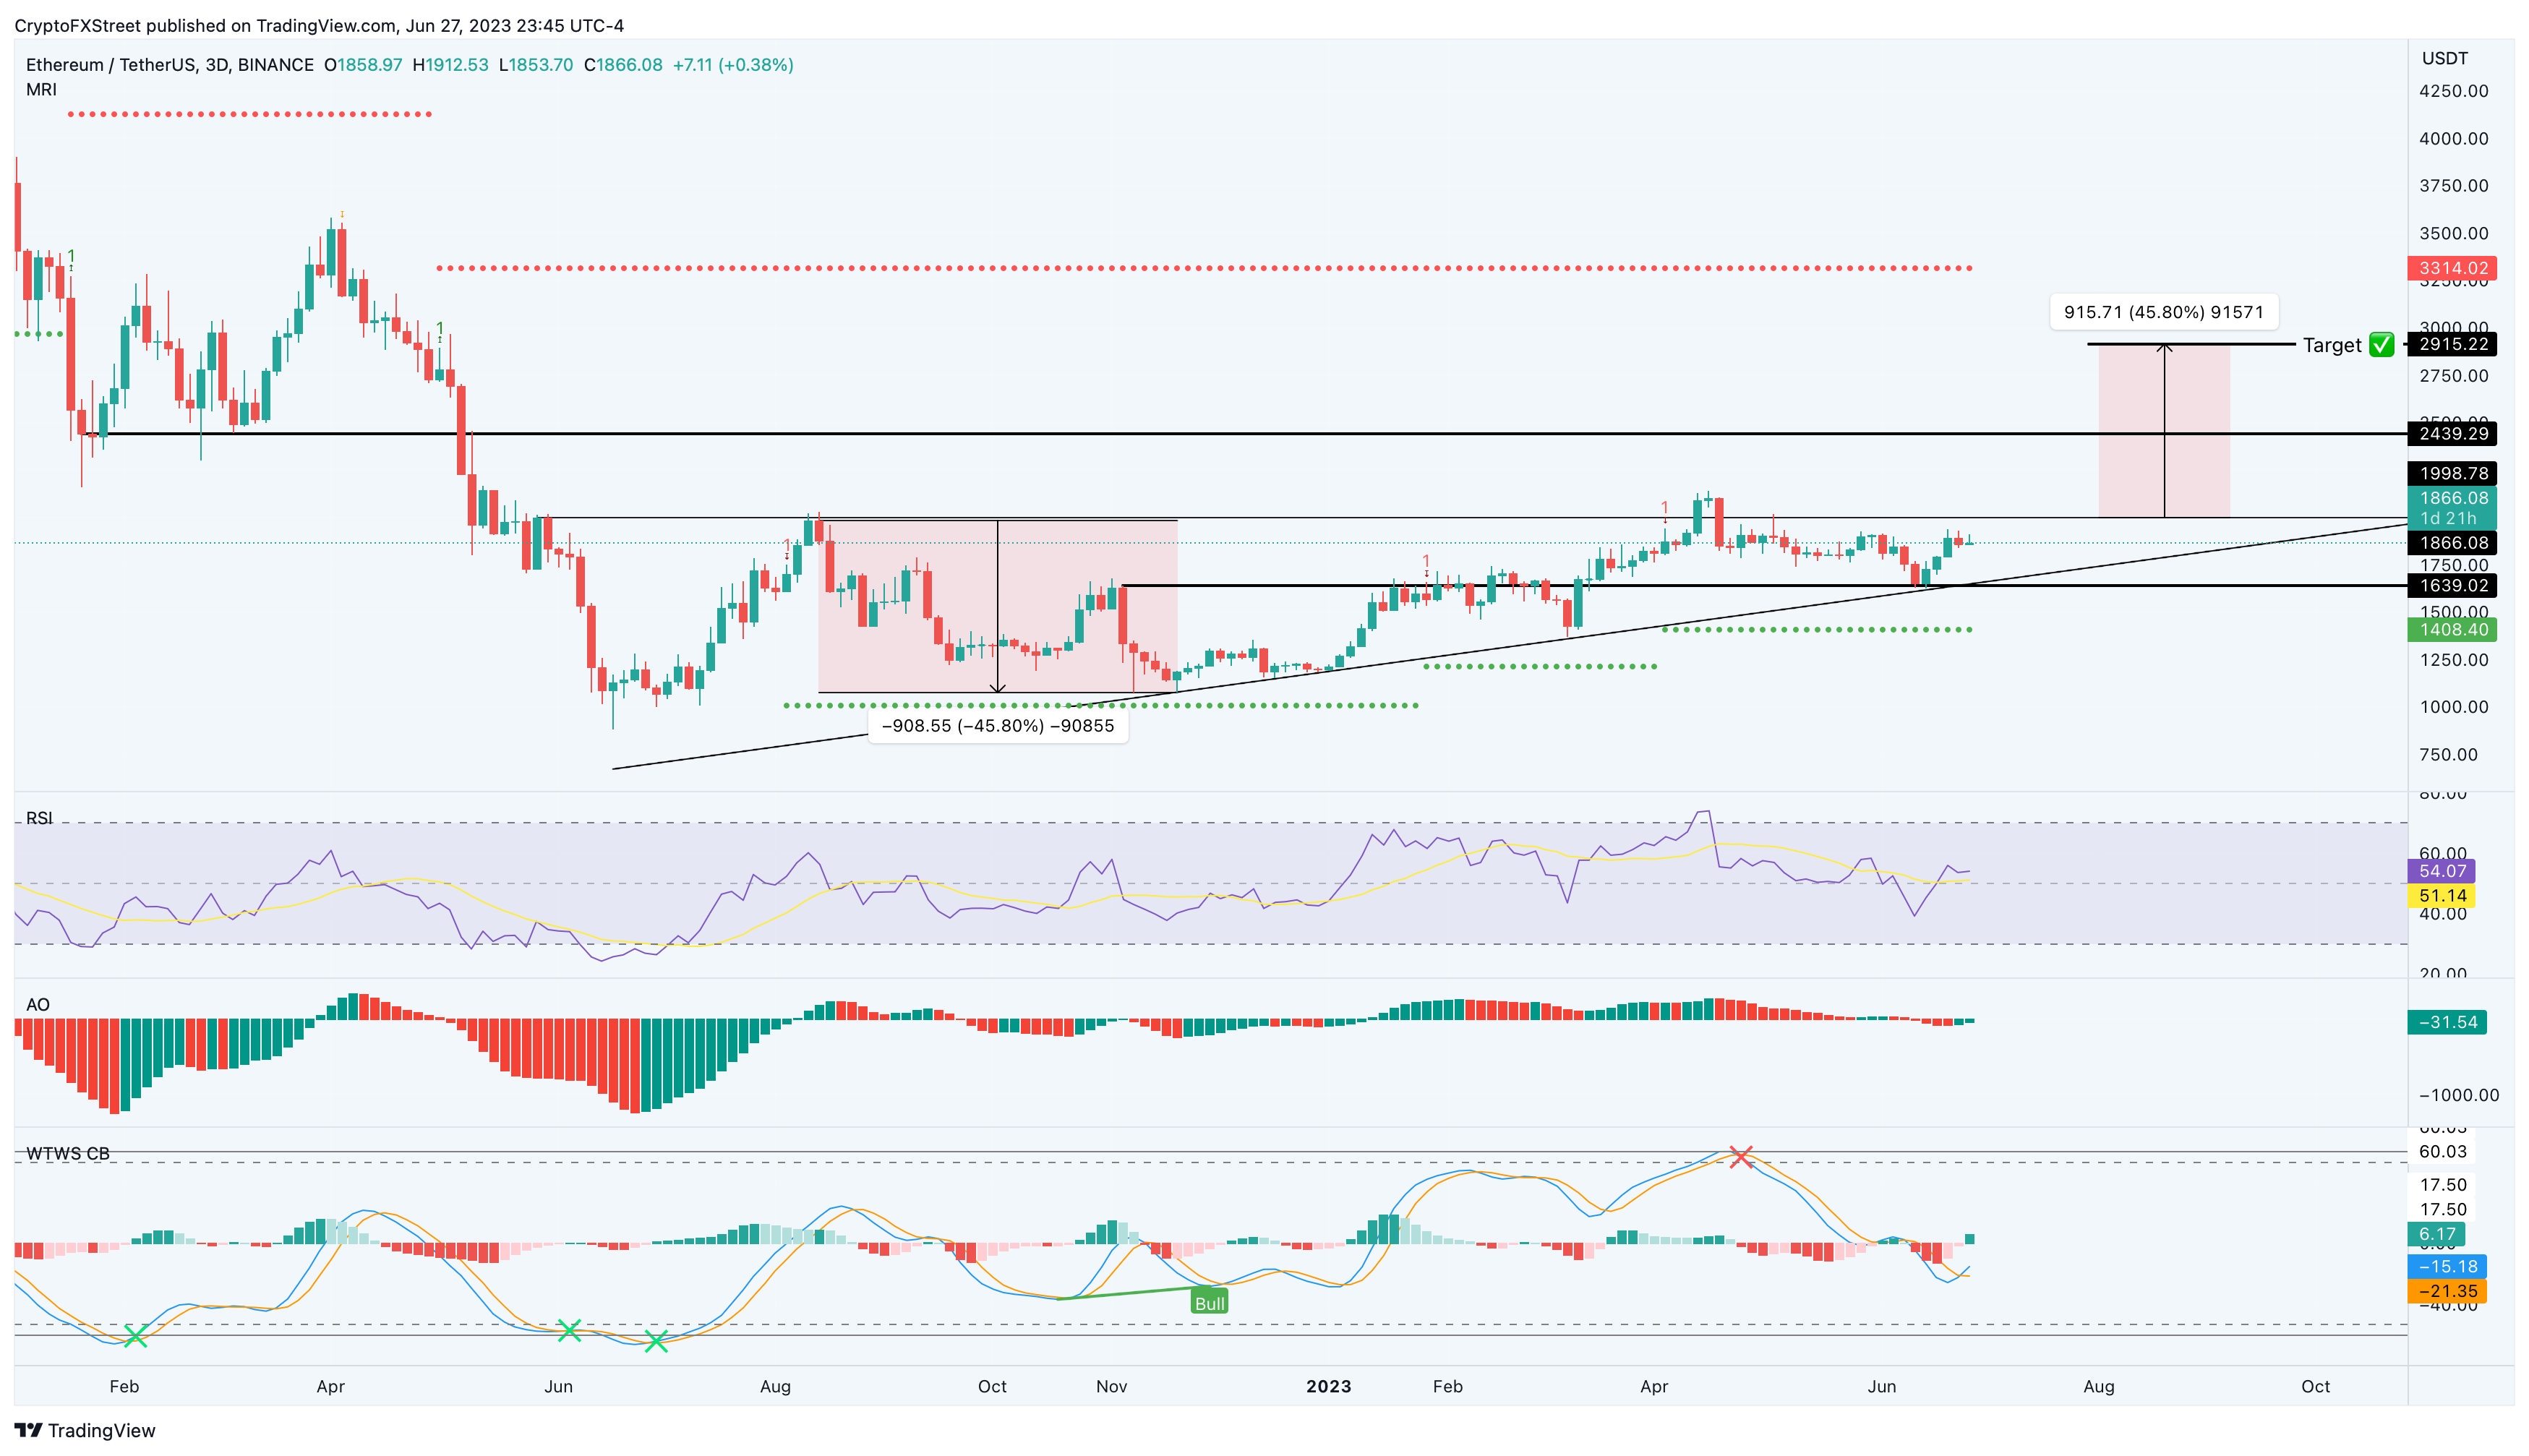
Ethereum (ETH) price looks extremely promising, not just from a technical point of view, but the indicators are also suggesting a bullish outlook. Between May 31, 2022, and June 28, 2023, ETH has set up an ascending triangle with roughly three equal highs and four higher lows.
This technical formation forecasts a 45% ascent to $2,915 upon the breakout of the $1,865 hurdle. The theoretical target is obtained by measuring the distance between the first swing high and swing low and adding it to the breakout point of the $1,865 resistance level.
Therefore, Ethereum price needs to produce a decisive flip of the aforementioned barrier to kickstart this massive bullish move.
Supporting this outlook are the RSI and AO indicators, both of which have moved above their respective mean lines - 50 and 0. This development signals a shift in momentum favoring the bulls. Furthermore, the Wave Trend indicator has produced a bullish crossover just above the oversold zone, adding credence to the bullish thesis.
Therefore, investors need to be patient as this is a long-term outlook that will take quite a while to play out.
ETH/USDT 3-day chart
On the other hand, if Ethereum price produces a decisive three-day candlestick close below $1,639, it will invalidate the ascending triangle’s bullish thesis. A further spike in selling pressure could trigger a near 15% descent to $1,408.
Ripple price needs clarity
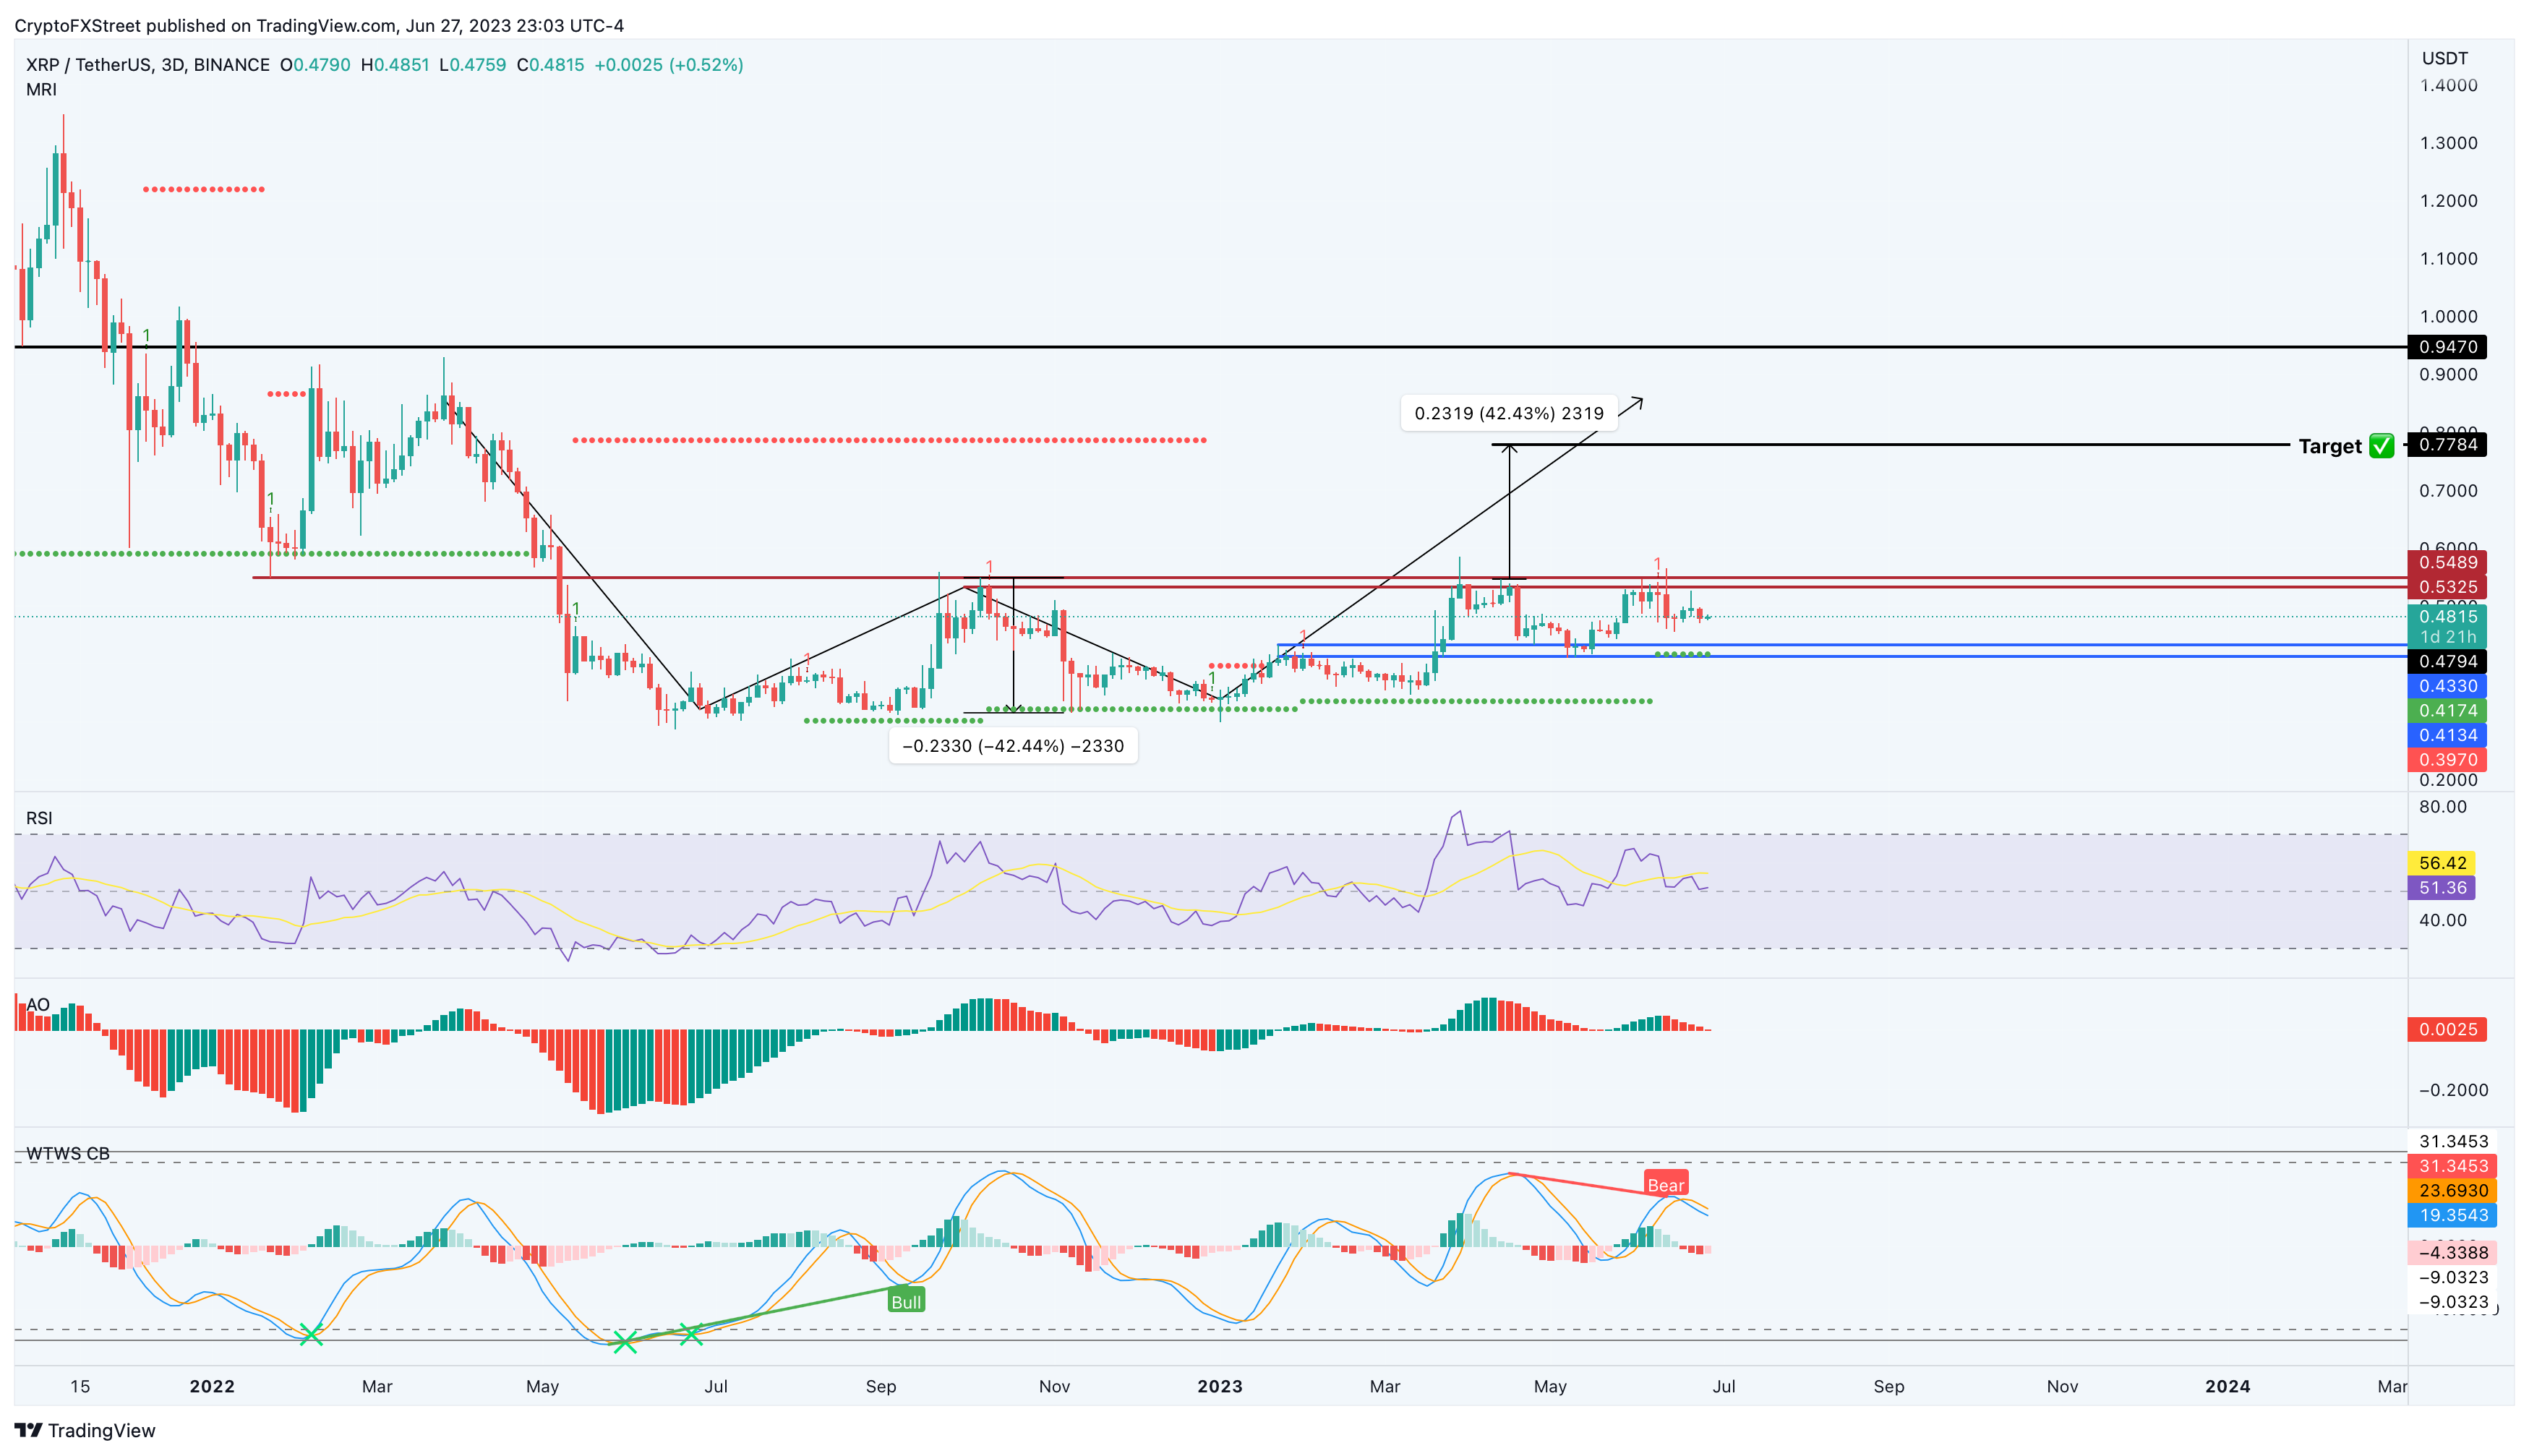
Ripple (XRP) price has been stuck trading between the $0.548 and $0.413 barriers since March 26. A decisive flip of the upper limit at $0.548 into a support floor would be a clear buy signal. In such a case, XRP could trigger a 40% ascent to $0.778, which is the target of the potential double bottom pattern, as shown in the chart below.
Interestingly, the aforementioned Ripple price target also coincides with MRI’s State Trend Resistance level, making it a key level to book profits.
XRP/USDT 3-day chart
While it is assumed that a breakout of $0.548 would lead to a Ripple price rally, investors need to take another look at the indicators. The RSI and AO indicators have produced clear lower lows, while the XRP price has produced equal highs. Such a setup is termed “exaggerated bearish divergence,” and it often leads to a steep correction for the underlying asset.
The Wave Trend indicator has also signaled a bearish divergence, aligning with the overall bearish outlook. Therefore, a pullback that breaks below the $0.413 support level will invalidate the bullish thesis. Such a move could result in a 17% correction to the next State Trend Support level at $0.334.
Also read: New evidence suggests SEC's common enterprise claim against Ripple doesn't hold, John Deaton says
Like this article? Help us with some feedback by answering this survey:
Author

Akash Girimath
FXStreet
Akash Girimath is a Mechanical Engineer interested in the chaos of the financial markets. Trying to make sense of this convoluted yet fascinating space, he switched his engineering job to become a crypto reporter and analyst.


