Top 3 Price Prediction Bitcoin, Ethereum, Ripple: BTC, ETH, and XRP stall at significant Fibonacci levels
- Bitcoin price stalls at the 361.8% Fibonacci extension of 2017-2018 bear market.
- Ethereum price fails at the 138.2% extension of February correction.
- XRP price welcomes bullish news role.

The listing of Coinbase today under the NASDAQ ticker symbol COIN is not only a watershed moment for the company but an essential step for mainstream investors who are skeptical about directly buying digital currencies but may be convinced to own the market through a Securities and Exchange Commission approved central exchange that handles the transactions.
A more stable trading experience will permit investors to hedge their bets on the future proliferation of cryptocurrencies with a well-placed company that will earn trading revenues that are not directly impacted by the price swings of any one token.
Institutional investors and analysts such as Dan Ives from Wedbush marvel at the opportunity to own the “foundational piece of the crypto ecosystem.” Coinbase is viewed as the gauge for the adoption of not only Bitcoin but also the entire cryptocurrency complex moving forward.
The Co-founder and current CEO, Brian Armstrong, envisions something bigger for Coinbase.
To increase economic freedom in the world. Everyone deserves access to financial services that can help them build a better life for themselves and their families.
From a broader perspective, the Coinbase listing appears to be a win-win situation for individual and institutional investors and the people seeking financial freedom from the current system.
Bitcoin price may rally to $67,650 before a deep correction
The unfolding price structure continues to take the form of a rising wedge pattern with one more touch of the upper trendline needed to complete the pattern. It would represent a marginal new high for the flagship cryptocurrency near $67,650, but first is the unfolding test of the 361.8% extension of the 2017-2018 bear market at $63,777.
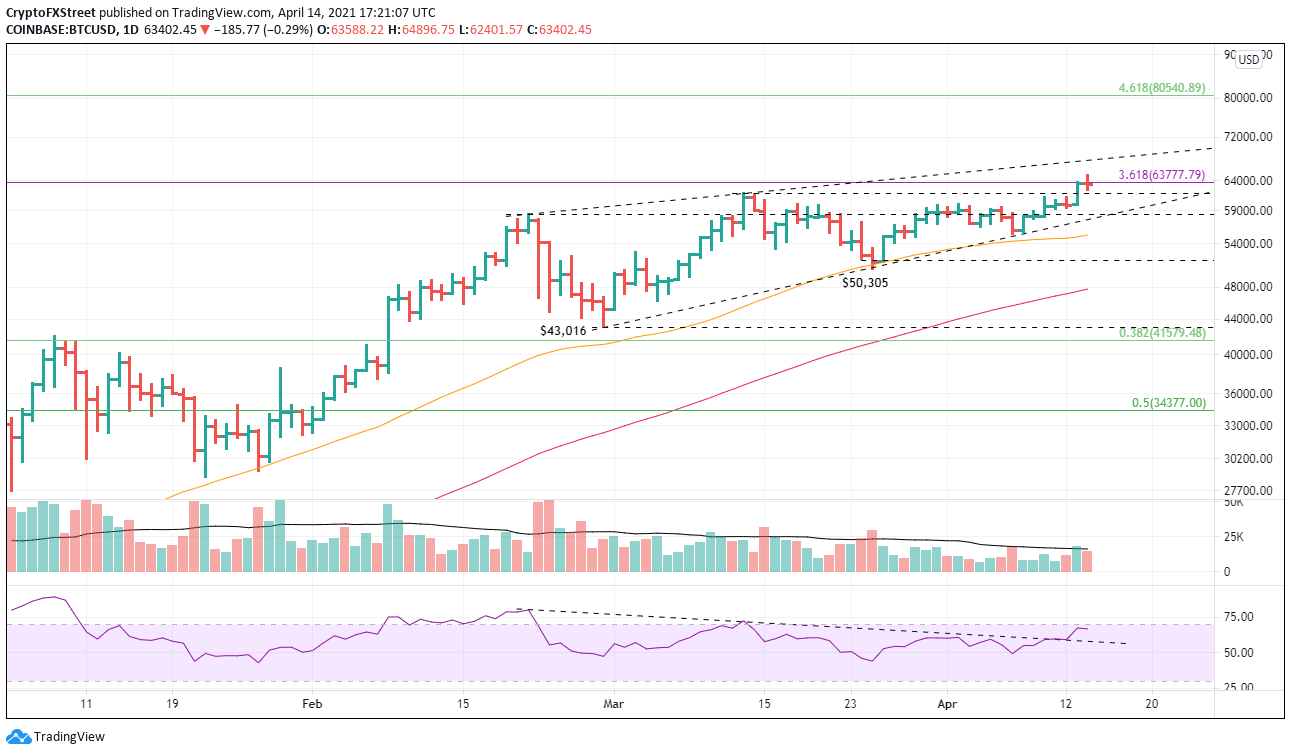
BTC/USD daily chart
If the current rally fails before testing the wedge’s upper trend line, BTC will find support at the lower trend line at $57,600, followed by the 50-day simple moving average at $55,277.
The incremental support continues to the March low at $50,305 and then the 100-day SMA at $47,770, before a final test of the February low at $43,016.
Ethereum price may be looking for a run similar to 2017
It has been 16 days since the breakout from a symmetrical triangle breakout. The path has included the battle with the February high’s magnet effect and now the successful close above the 161.8% Fibonacci extension of the 2018 bear market at $2,247.
The current outlook anticipates a continuation of ETH strength to the 161.8 extension of the February correction at $2,504, followed immediately by the triangle’s measured move target of $2,507.
Once the current Fibonacci resistance cluster is cleared, ETH could rally to the 261.8% extension of the February correction at $3,253 and even the 261.8% extension of the 2018 bear market at $3,587.
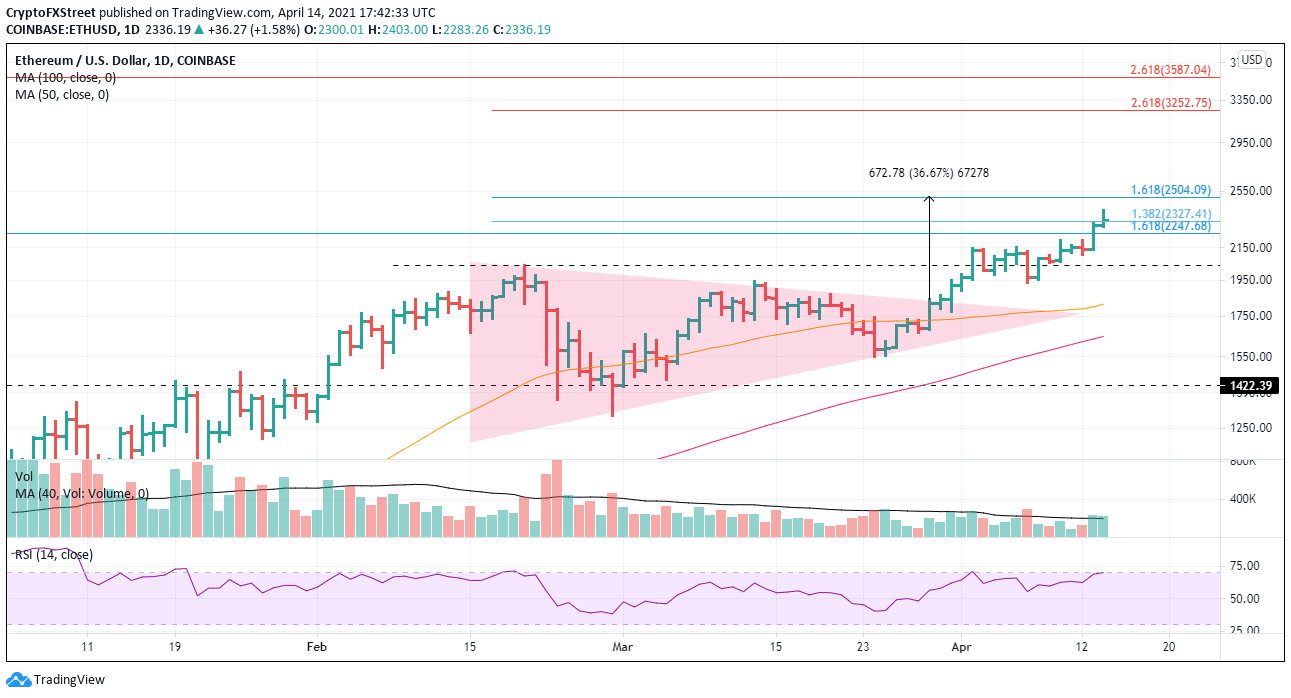
ETH/USD daily chart
A big negative for the ongoing rally is the absence of heavy volume. For most positive days, the volume has got to average and no more. This could impede ETH as it wrestles with the current Fibonacci resistance.
XRP price stalls at psychologically important $2
It has been a stream of bullish news for Ripple over the last few weeks. The newest is the cross-border remittances cryptocurrency executives filing to dismiss the SEC case hanging over XRP since December 2020.
XRP price action reflects the bullishness with an explosive advance over the last weeks that has lifted it near the 61.8% retracement of the 2018-2020 bear market at $2.08. With the daily chart flashing a mild bearish momentum divergence, speculators need to prepare for a pause to release some of the price compression generated by the wicked advance.
Following the consolidation, it is anticipated that XRP will challenge the 78.6% retracement at $2.617 before launching a test of the all-time at $3.30 over the medium term.
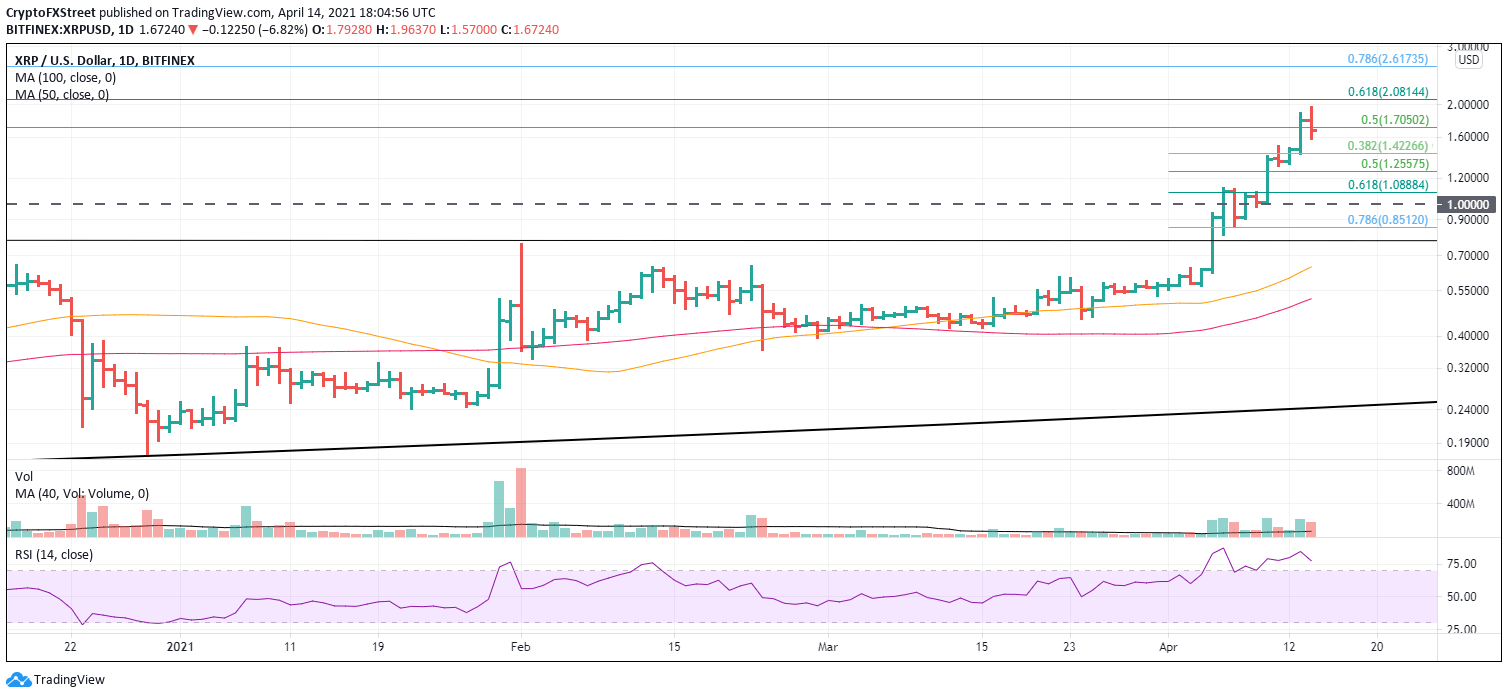
XRP/USD daily chart
XRP has traveled a long distance in a short time, and speculators need to be mindful of critical support at the 38.2% retracement of the April rally at $1.42 and then the 50% retracement at $1.26.
Author

Sheldon McIntyre, CMT
Independent Analyst
Sheldon has 24 years of investment experience holding various positions in companies based in the United States and Chile. His core competencies include BRIC and G-10 equity markets, swing and position trading and technical analysis.


