Ethereum Price Prediction: ETH might create another opportunity for buyers to kick-start new uptrend
- Ethereum price has tagged a resistance level at $2,552 but failed to breach through.
- This rejection has caused a potential lower high to be formed, indicating a possible downswing.
- A bounce from the 62% or the 70.5% Fibonacci retracement levels at $2,177 and $2,077, respectively, would be an excellent place to start a new uptrend.

Ethereum price is currently trading below a critical resistance level and is trying to breach past it. A decisive close above the swing high on June 9 will create a higher high and signal the start of an uptrend.
However, a failure to generate a new high will lead to a sell-off, which will allow the bulls to recuperate and give the upswing another try.
Ethereum price at crossroads
Ethereum price has created three lower highs and lower lows since June 3, indicating a downtrend in progress. Although ETH appeared to have formed a bottom on June 12 and 13, the rally that originated here seems to have failed.
Rejection at the resistance level at $2,552 and the lack of buying pressure have played a role in preventing the rise of ETH price.
While the buyers still have a chance to band together and propel it higher, a potential spike in selling pressure that pushes Ethereum price to produce a decisive 4-hour candlestick close below the 50% Fibonacci retracement level at $2,319 will invalidate the bullish outlook.
In such a case, the smart contract token is likely to dip to retest the 62% or the 70.5% Fibonacci retracement levels at $2,177 and $2,077, respectively.
In a highly bearish case, the 79% Fibonacci retracement level at $1,976 might be tagged as well. Therefore, investors need to exercise caution for price swings below the barrier mentioned above.
A bounce from either of the crucial support floors would be a perfect place for the buyers to bid, leading to a build-up of buying pressure. Therefore, investors can expect a new uptrend to evolve here.
The bullish momentum that evolves at either of these levels might target the range high at $2,909.
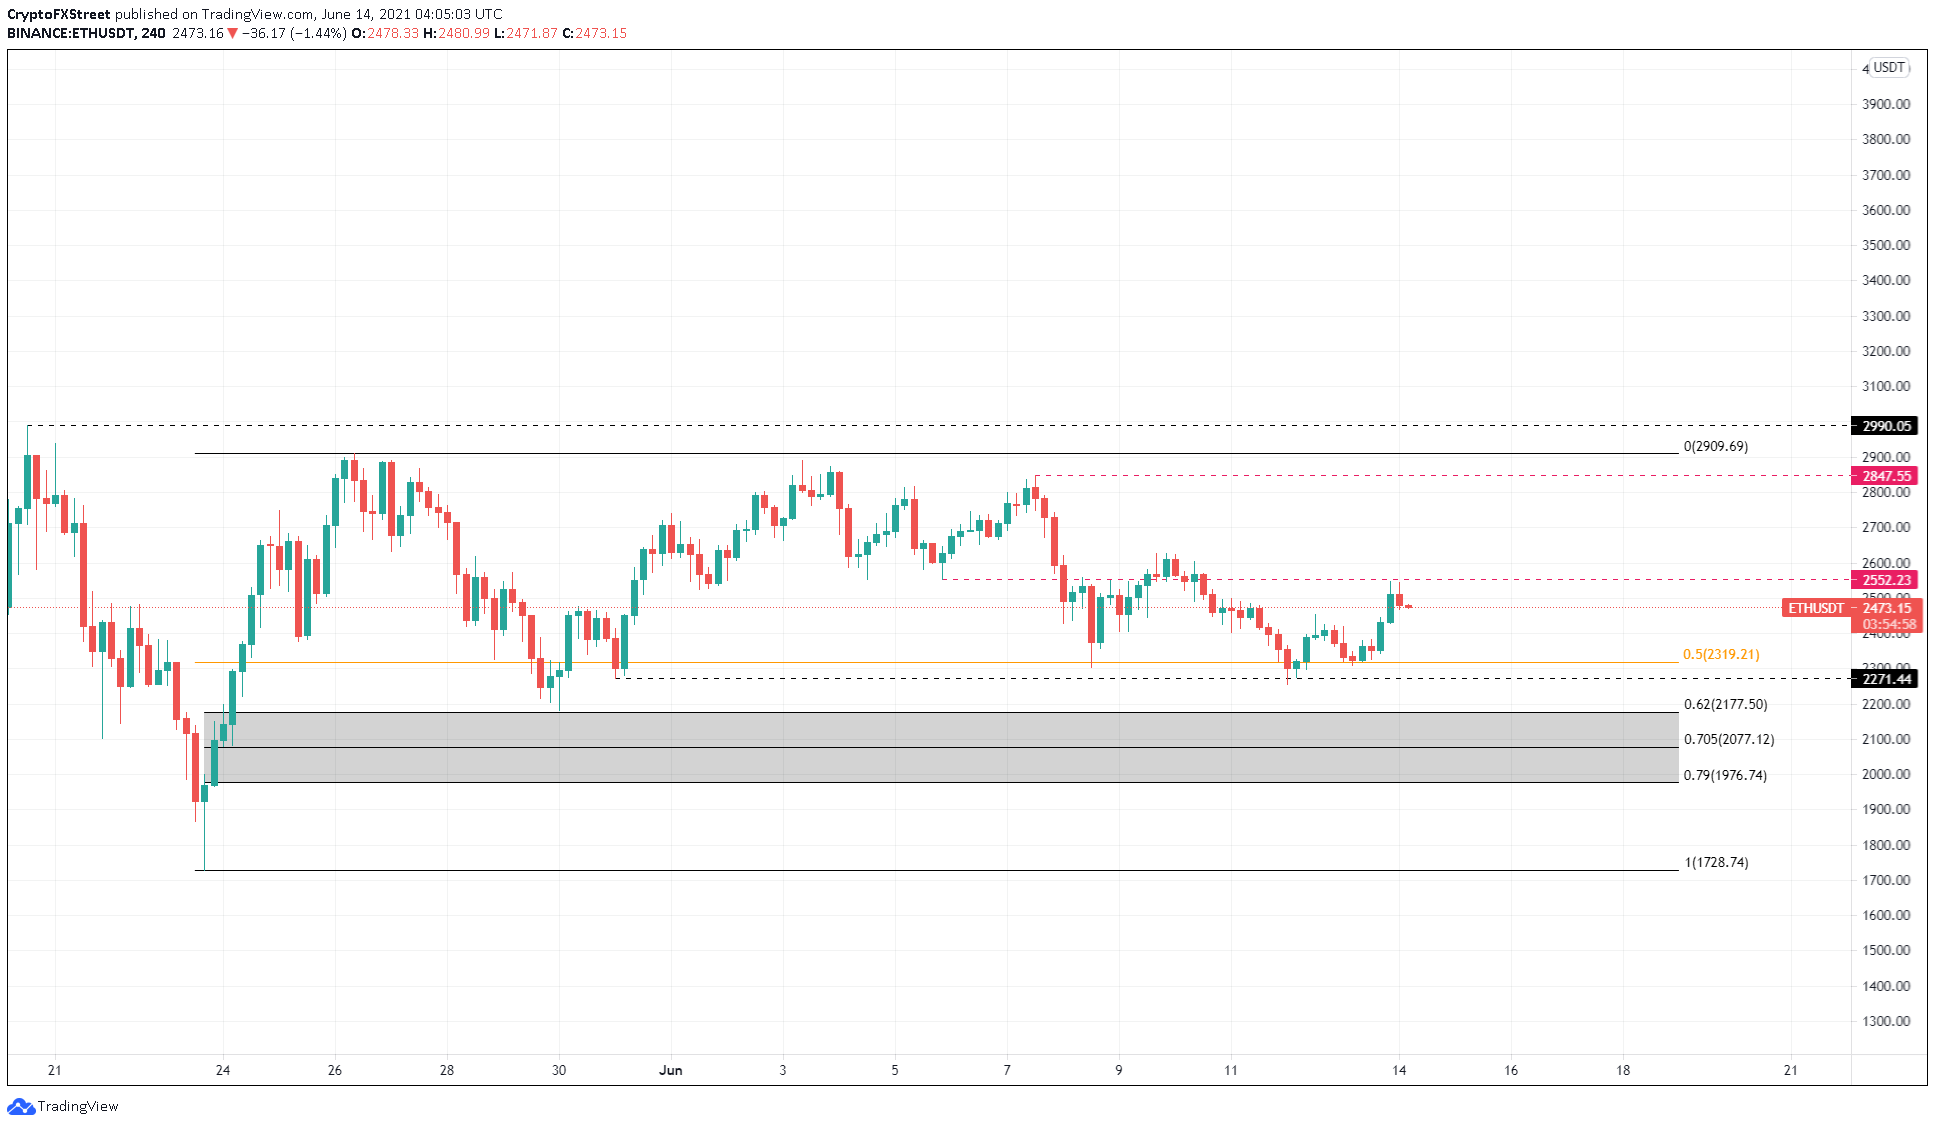
ETH/USDT 4-hour chart
The number of active addresses for Ethereum has dropped from 764,000 to 505,000 between May 13 to date. This 34% decline indicates that investors are becoming scarce and are uninterested in ETH at current price levels.
Moreover, the past week alone saw more than a 3% decline in the daily active addresses from roughly 520,000 to 505,000, suggesting that market participants might either be booking profits or reallocating their funds.
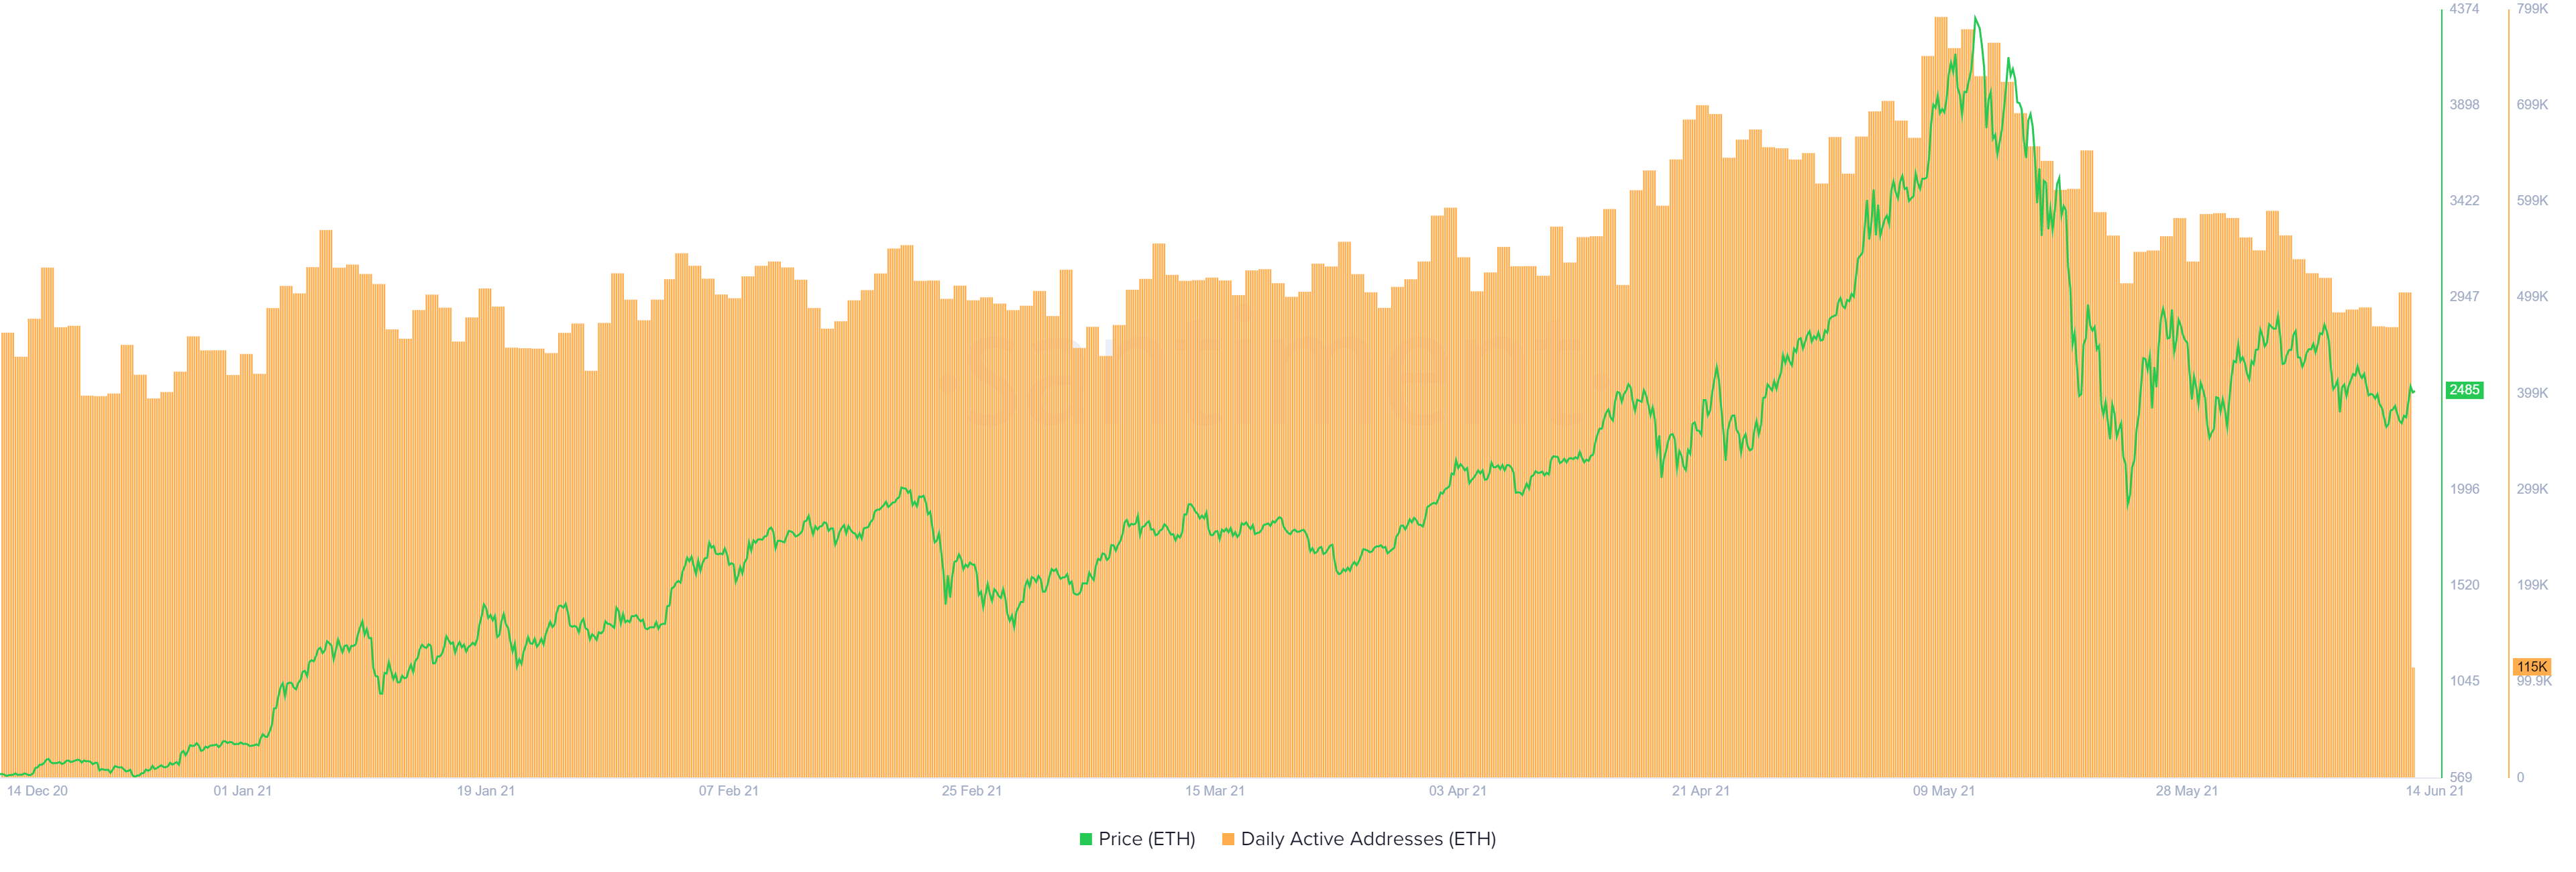
ETH daily active addresses chart
The 365-day Market Value to Realized Value (MVRV) model suggests more room to the south, further backing the initial bearish outlook mentioned above. This fundamental index tracks the average profit/loss of investors who purchased ETH over the past year. A high MVRV number indicates that most users are in profit, revealing that these market participants might sell their holdings to realize gains, thereby adding selling pressure.
Currently, the 365-day MVRV has dropped from 51% on June 1 to 39.3% today, suggesting that 39% of the investors are still in profit and might sell their tokens and potentially add to ETH’s woes.
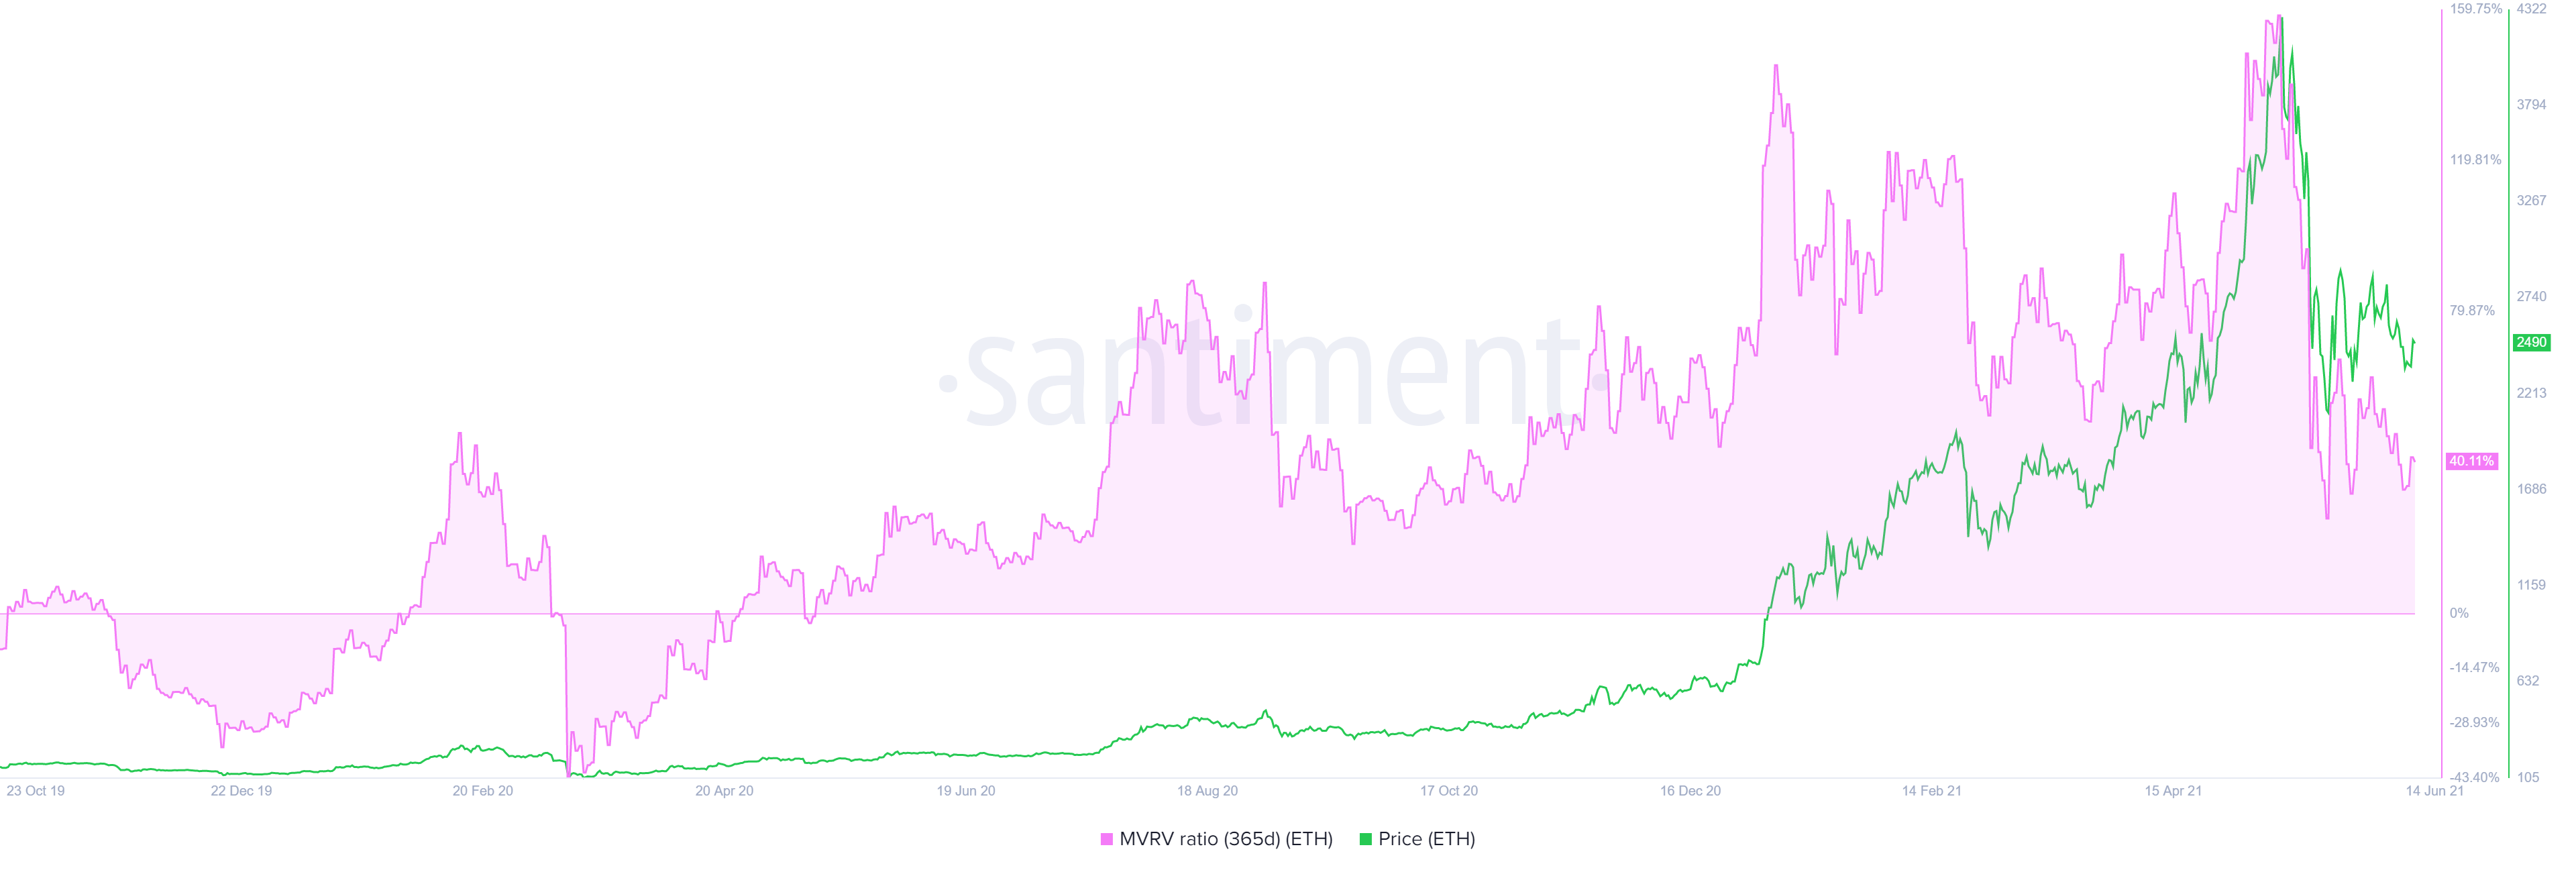
ETH 365-day MVRV chart
While all of these on-chain metrics support the initial downswing, the percentage of ETH accumulated by addresses holding 1,000,000 to 10,000,000 tokens has risen from 17% on May 22 to 17.8% as of this writing.
Although the increase was small, it is an interest shown by whales, which represents a bullish outlook for ETH.
While the short-term outlook looks weak, a dip into the 62% or 70.5% Fibonacci retracement level at $2,177 and $2,077, respectively, would allow the buyers an opportunity to accumulate ETH at a discount and propel its market value higher.
However, if Ethereum price produces a decisive 4-hour candlestick close below $1,976, it will invalidate the upswing and kick-start a new downtrend that could tag the range low at $1,728.
Author

Akash Girimath
FXStreet
Akash Girimath is a Mechanical Engineer interested in the chaos of the financial markets. Trying to make sense of this convoluted yet fascinating space, he switched his engineering job to become a crypto reporter and analyst.


