Top 3 Price Prediction Bitcoin, Ethereum, Ripple: Bitcoin bounces off from the ascending trendline
- Bitcoin price retests the 50% retracement level at $62,736, a close below it would indicate a bearish move.
- Ethereum's price retests the daily support level of around $3,076, a break below would change the market structure from bullish to bearish.
- Ripple price continues to retrace but may find support at the $0.544 level before potentially resuming an upward rally.

Bitcoin (BTC) and Ethereum (ETH) have retested their key support levels, with a break below these levels potentially signaling a bearish trend ahead. At the same time, Ripple (XRP) shows resilience and could rally in the coming days after testing its key support level.
Bitcoin price at risk of decline after breaking below key support level
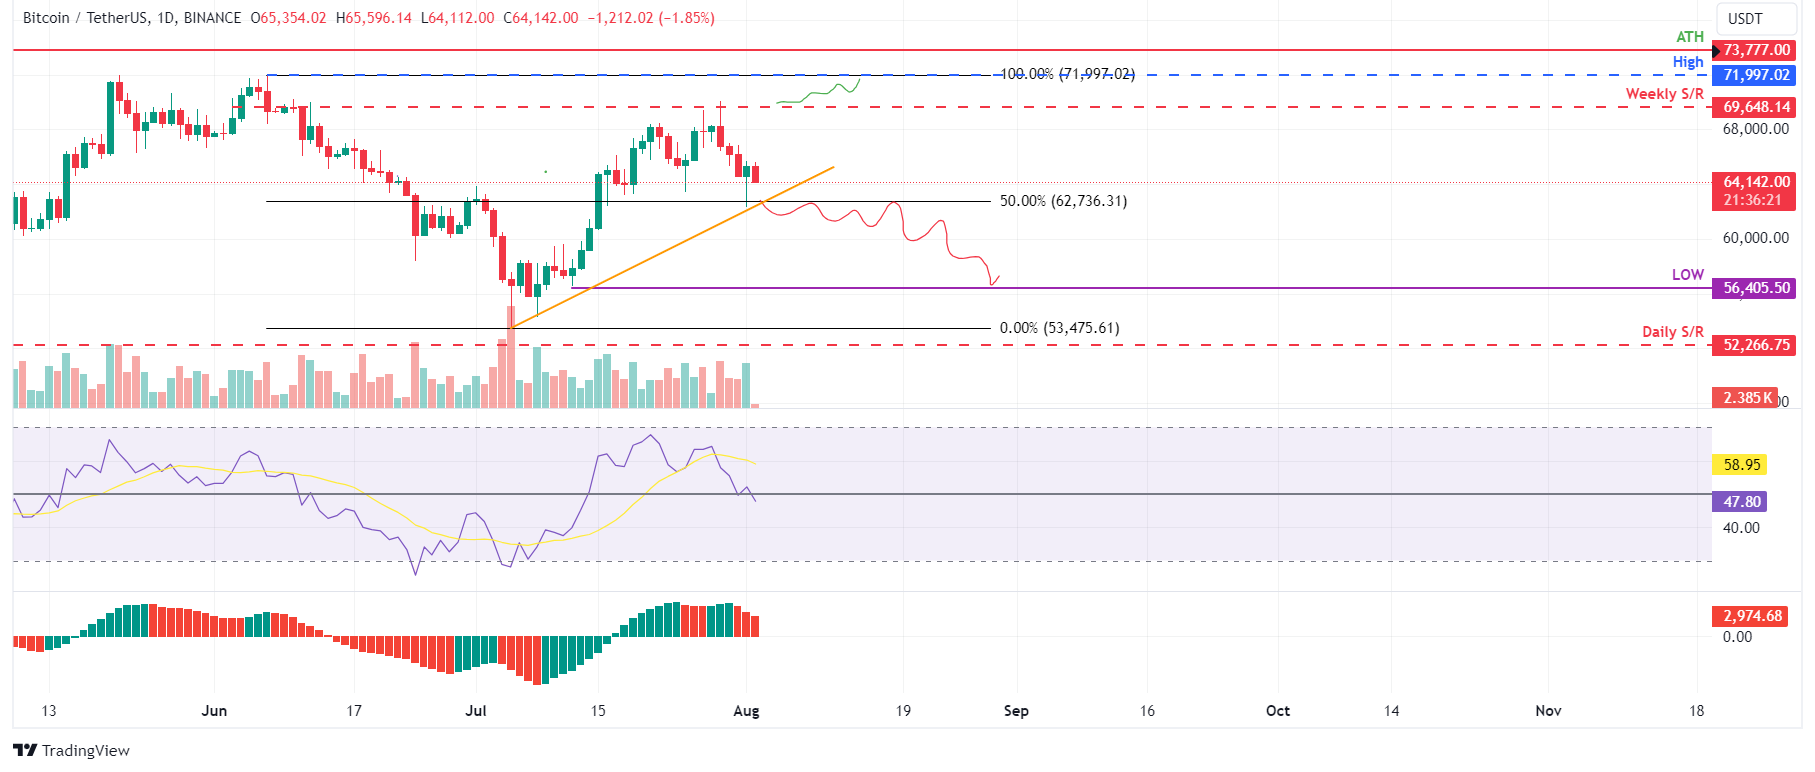
Bitcoin's price retested the ascending trendline support on Thursday, coinciding with the 50% Fibonacci retracement level at $62,736 (drawn from a swing high of $71,997 on June 7 to a swing low of $53,475 on July 5), establishing it as a critical support zone.
As of Friday, Bitcoin is trading slightly lower at $64,142, down 1.7%.
If Bitcoin continues to decline and closes below the ascending trendline and the 50% Fibonacci retracement level, it could drop 10% to revisit the daily low of $56,405 from July 12.
The Relative Strength Index (RSI) on the daily chart has briefly fallen below the neutral 50 level, and the Awesome Oscillator (AO) is approaching a similar decline; sustained weakening in these momentum indicators could signal strong bearish pressure and further declines in Bitcoin's price.
BTC/USDT daily chart
However, a close above the $69,648 weekly resistance level would change the market structure by forming a higher high on the daily timeframe. Such a scenario might drive a 3% rise in Bitcoin's price to retest its June 7 high of $71,997.
Ethereum price faces potential decline after dropping below $3,076 support level
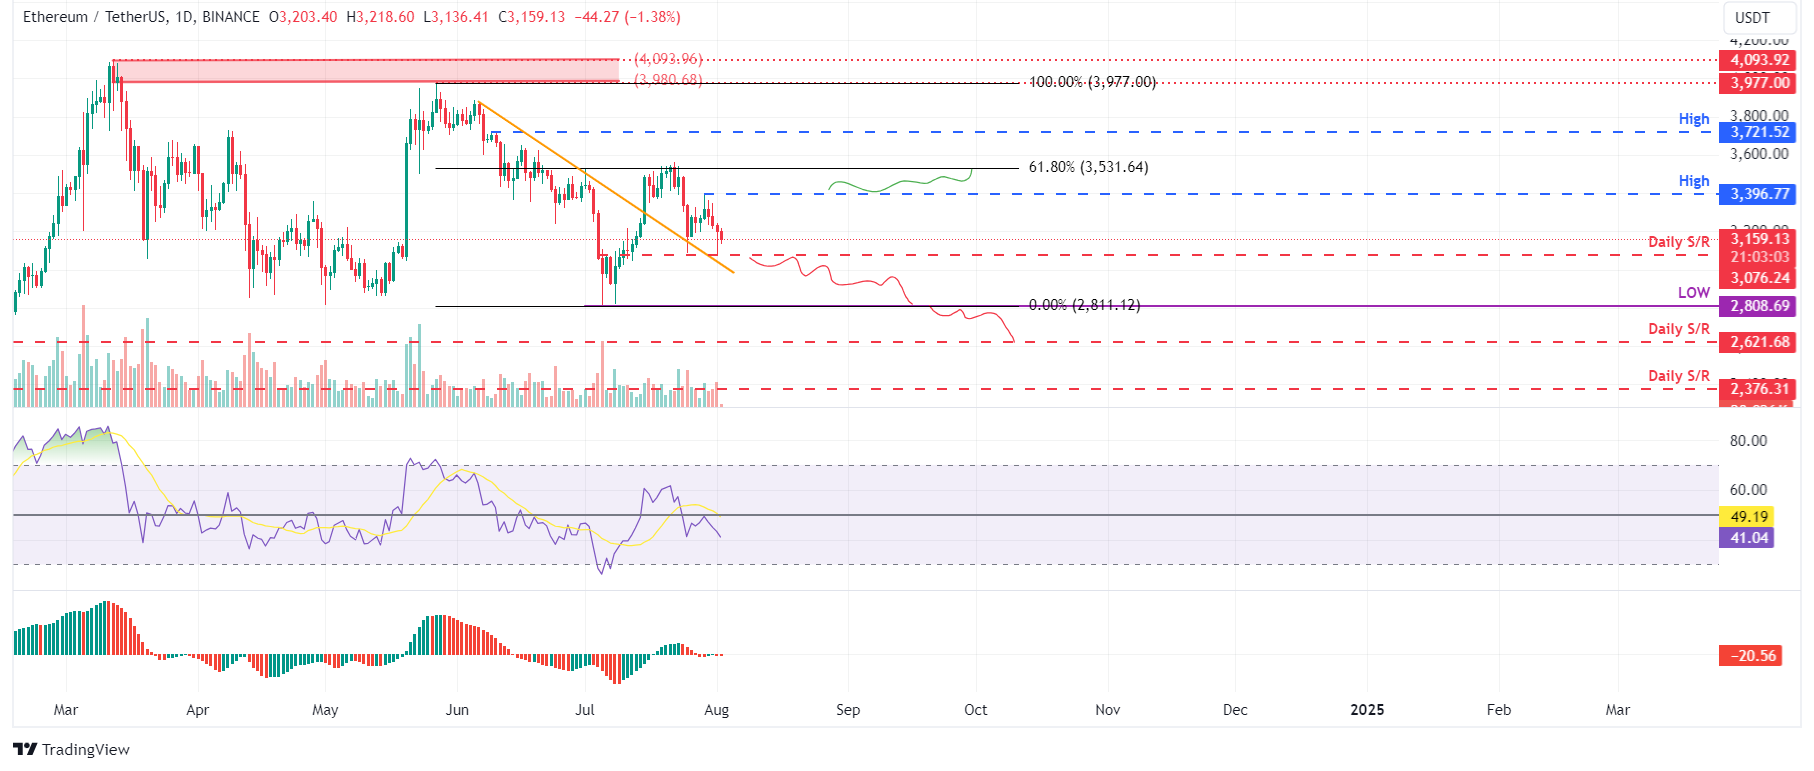
Ethereum price retested the daily support level of around $3,076 on Thursday, which aligns with the former trendline resistance now acting as support. As of Friday, ETH is trading slightly lower by 1.67% at $3,147.
If Ethereum's price continues to decline and closes below the daily support at $3,076 and the trendline, it could drop 9% to revisit the daily low of $2,808 from July 5.
The Relative Strength Index (RSI) and the Awesome Oscillator (AO) on the daily chart have fallen below their neutral levels of 50 and zero, respectively, signaling strong bearish dominance.
If this negative sentiment persists and the broader cryptocurrency market outlook remains weak, Ethereum could drop another 7% to test the support level at $2,621.
ETH/USDT daily chart
On the other hand, if Ethereum's daily candlestick closes above $3,396, forming a higher high in the daily timeframe, it may signal persistent bullish sentiment. This scenario could trigger a 4% rise in Ethereum price, targeting a revisit of its 61.8% Fibonacci retracement level at $3,531 from the May 27 high of $3,977 to the July 5 low of $2,808
Ripple price eyes rally after retesting $0.544 daily support level
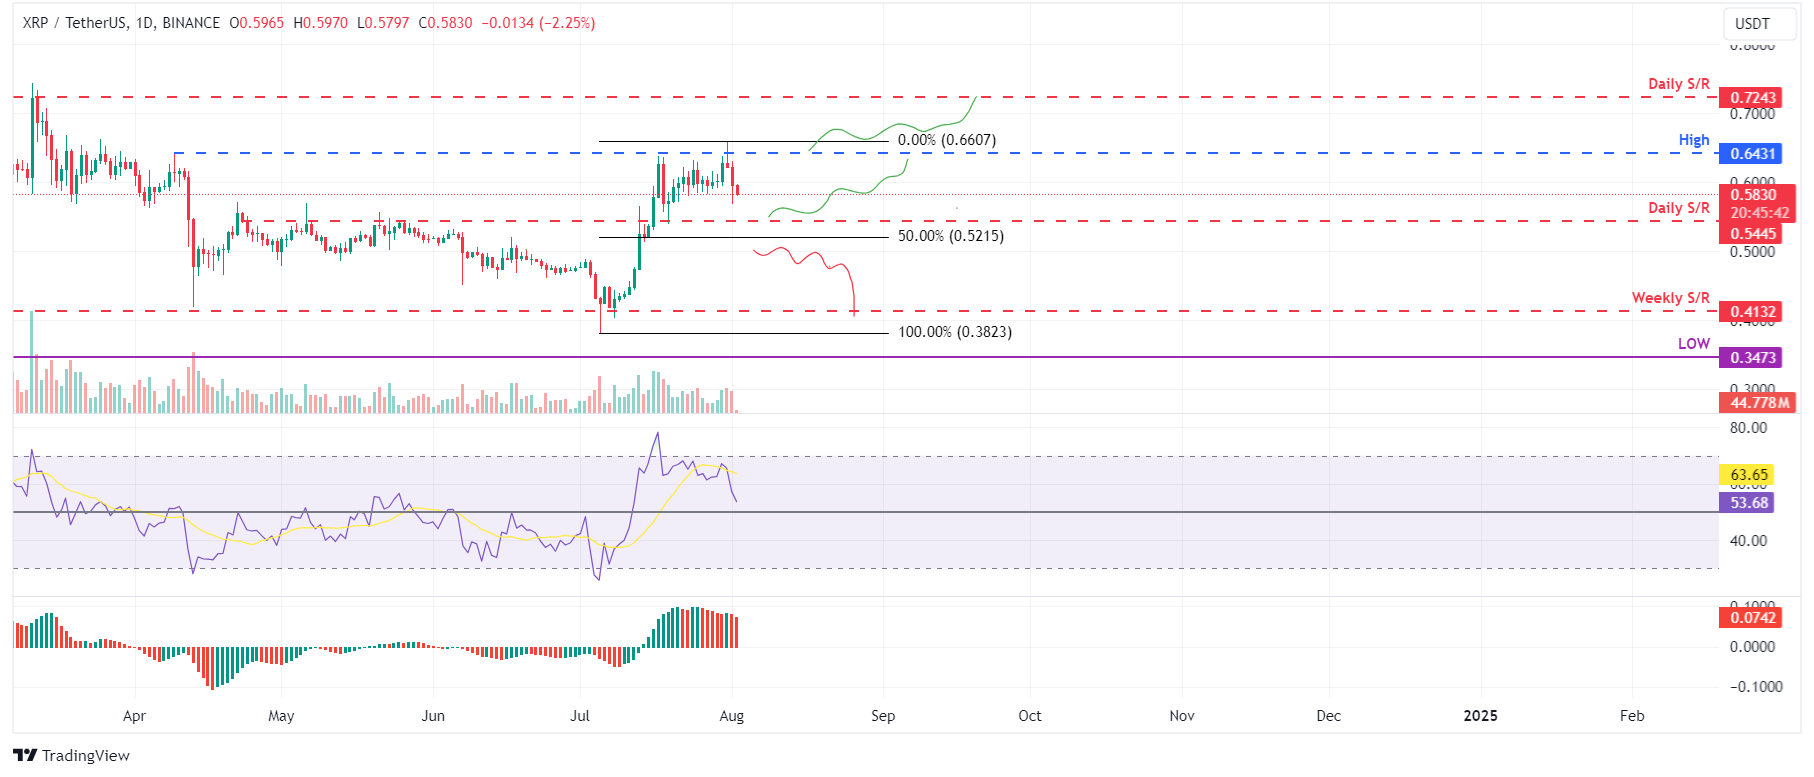
Ripple price failed to close above the $0.643 mark on Wednesday and fell 4.2% on Thursday. As of Friday, it is down an additional 2%, trading at $0.583.
If XRP continues to retrace, it may find support at the daily support level of $0.544. This level aligns with the 50% Fibonacci retracement level at $0.521, calculated from the swing low of $0.382 on July 5 to the swing high of $0.660 on July 31.
If the $0.544 level holds, XRP could rally 18.5% to retest the July 31 daily high of $0.660.
On the daily chart, the Relative Strength Index (RSI) and the Awesome Oscillator (AO) are currently above their neutral levels of 50 and zero, respectively. These momentum indicators strongly indicate bullish dominance.
XRP/USDT daily chart
However, if Ripple's daily candlestick closes below the $0.521 level, it indicates sustained bearish sentiment, forming a lower low in the daily timeframe. Such a scenario could lead to an 18% crash in Ripple price, targeting a revisit of its weekly support at $0.413.
Author

Manish Chhetri
FXStreet
Manish Chhetri is a crypto specialist with over four years of experience in the cryptocurrency industry.



