Bitcoin Price Forecast: BTC hits new yearly low below $75,000 as global trade war escalates
- Bitcoin price extends its fall by 4% on Monday after correcting near 5% the previous week.
- The global trade war escalated, wiping out 452,976 leveraged traders and causing a total liquidation of $1.39 billion from crypto markets in the last 24 hours.
- US Bitcoin spot ETFs recorded a total net outflow of $172.69 million last week.

Bitcoin (BTC) recovers part of the initial losses and trades around $76,000 at the time of writing on Monday after reaching a new yearly low of $74,508 during the Asian trading session. However, BTC extends its fall on a daily basis after correcting near 5% the previous week. The global trade war escalated, wiping out 452,976 leveraged traders and causing a total liquidation of $1.39 billion from crypto markets in the last 24 hours. Moreover, the US institutional demand has weakened as it recorded a net outflow of $172.69 million from its spot Exchange Traded Funds (ETFs) last week.
Trade war escalates, wiping $1.39 billion from crypto markets
Bitcoin price reached a new yearly low of $74,508 during the earlier Asian trading session but hovered around $76,000 during the European session on Monday. This price crash was mainly fueled by US President Donald Trump’s tariffs announcement last Wednesday, which led to a nearly 5% decline in BTC last week.
This announcement has sparked a global trade war, with China retaliating by imposing a 34% levy on US goods. This trade war escalation has caused a fall not only in the crypto market but also in Asian markets, as shown in the chart below. Japan’s stock market reached its lowest level since October 2023 on Monday.

The effects of the global trade war triggered a wave of liquidation in the crypto markets. According to the Coinglass Liquidation Heatmap chart, in the last 24 hours, 452,976 traders were liquidated, and the total liquidations came in at $1.39 billion. The largest single liquidation order happened on OKX - BTC-USDT-SWAP, valued at $7.08 million.
Bitcoin saw over $464 million in liquidation, while Ethereum saw $408.49 million. Huge liquidations like this could spark Fear, Uncertainty and Doubt (FUD) among Bitcoin investors and cause a rise in selling pressure, leading to further price declines.

Liquidation Heatmap chart. Source: Coinglass
Institutional demand shows weakness
Institutional demand weakened as uncertainty arose in the market last week. According to the SoSoValue data, the US spot Bitcoin ETF recorded a net outflow of $172.69 million last week after a positive inflow of $196.48 million the previous one. The data further shows that the weekly netflow has been weak since mid-February, one month after Donald Trump’s inauguration on January 20. If the net outflow continues and intensifies, Bitcoin’s price could see further correction ahead.

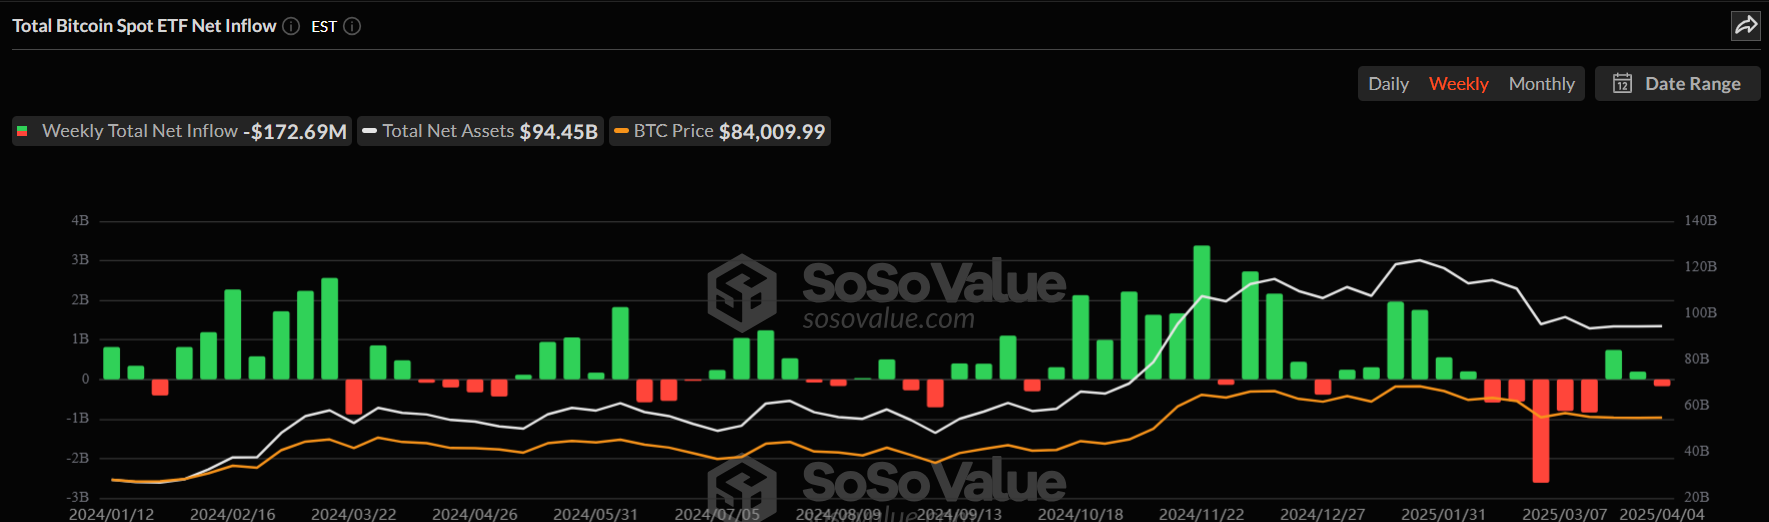
Total Bitcoin spot ETF inflow weekly chart. Source: SoSoValue
Some signs of optimism
Despite rising global trade war tension and falling institutional-level demand, some signs of optimism exist. On Monday, Hong Kong’s Securities and Futures Commission (SFC) released guidance for licensed virtual asset trading platforms (VATPs) and crypto ETFs to offer staking services, aiming to bolster the region’s crypto hub ambitions amid global competition.
This decision to allow staking for licensed platforms and ETFs is generally a positive sign for Bitcoin. It indicates a maturing crypto ecosystem that indirectly benefits Bitcoin by fostering institutional adoption, regulatory clarity, and global competition. As Bitcoin doesn’t directly benefit from staking, the broader infrastructure growth in Hong Kong could drive demand for Bitcoin through ETFs and institutional investment.
Bitcoin bears hit a new yearly low of $74,508
Bitcoin’s price declined by almost 5% last week after being rejected from its key level of $85,000. At the time of writing on Monday, BTC has fallen below the $78,258 daily support and has broken its previous yearly low of $76,606 (March 11 low), reaching a new year-to-date low of $74,508.
If BTC continues its downward trend, it could extend the decline to retest its next daily support level at $73,072.
The Relative Strength Index on the daily chart reads 33, indicating strong bearish momentum while still out of oversold conditions. The Moving Average Convergence Divergence (MACD) indicator also showed a bearish crossover on Sunday, giving a sell signal and suggesting a downward trend.

BTC/USDT daily chart
If BTC recovers, it could extend the recovery to retest its daily resistance at $85,000.
Bitcoin, altcoins, stablecoins FAQs
Bitcoin is the largest cryptocurrency by market capitalization, a virtual currency designed to serve as money. This form of payment cannot be controlled by any one person, group, or entity, which eliminates the need for third-party participation during financial transactions.
Altcoins are any cryptocurrency apart from Bitcoin, but some also regard Ethereum as a non-altcoin because it is from these two cryptocurrencies that forking happens. If this is true, then Litecoin is the first altcoin, forked from the Bitcoin protocol and, therefore, an “improved” version of it.
Stablecoins are cryptocurrencies designed to have a stable price, with their value backed by a reserve of the asset it represents. To achieve this, the value of any one stablecoin is pegged to a commodity or financial instrument, such as the US Dollar (USD), with its supply regulated by an algorithm or demand. The main goal of stablecoins is to provide an on/off-ramp for investors willing to trade and invest in cryptocurrencies. Stablecoins also allow investors to store value since cryptocurrencies, in general, are subject to volatility.
Bitcoin dominance is the ratio of Bitcoin's market capitalization to the total market capitalization of all cryptocurrencies combined. It provides a clear picture of Bitcoin’s interest among investors. A high BTC dominance typically happens before and during a bull run, in which investors resort to investing in relatively stable and high market capitalization cryptocurrency like Bitcoin. A drop in BTC dominance usually means that investors are moving their capital and/or profits to altcoins in a quest for higher returns, which usually triggers an explosion of altcoin rallies.
Author

Manish Chhetri
FXStreet
Manish Chhetri is a crypto specialist with over four years of experience in the cryptocurrency industry.


