Top 3 Price Prediction Bitcoin, Ethereum, Ripple: Bearish trend intact but expect a rebound
- Bitcoin price still respects bearish trendline but refrains from testing support as bulls keep buying.
- Ethereum price stays in the distribution zone and sees volume on the buy-side increase even further, set for a breakout.
- XRP price loses its monthly pivot from May and June's pivot is nowhere near in sight as bulls grope for support.

Bitcoin price, Ethereum and other cryptocurrencies are in perfect equilibrium, with price action consolidating, forming lower highs and higher lows in the process. Buyers and sellers are getting squeezed into one another as a bearish triangle reaches completion in all three cryptocurrencies, ready for a possible breakout either next week or the week after that. The catalyst needed for that breakout will either be a central bank surprise, or a geopolitical event, so watching the headlines will be crucial to time the exact moment for engaging right.
Bitcoin price set to jump 15%
Bitcoin (BTC) price is still respecting the downtrend thus far after prices received a firm rejection against the red descending trend line. As price action came back down in search of support, bulls refrained from letting the Bitcoin price slip to $28,695.13 but instead bought earlier to trade around $30,000. From here BTC price will probably go back and forth above and below $30,000, awaiting a significant catalyst to light the fuse for the breakout.
BTC price has seen the Relative Strength Index trading upwards, showing signs that bulls are buying massively and are preparing for the summer rally from which they got a preview two weeks ago. Risk appetite is present, but within a narrow window of opportunity as it will all depend on the central banks and how they steer global economies around inflation worries. Expect BTC price to pop above $31,321.98, entering a distribution zone where buyers can get the chance to break the downtrend and pop up towards $32,649.28 to test the 55-day Simple Moving Average whilst booking 15% gains in the process.
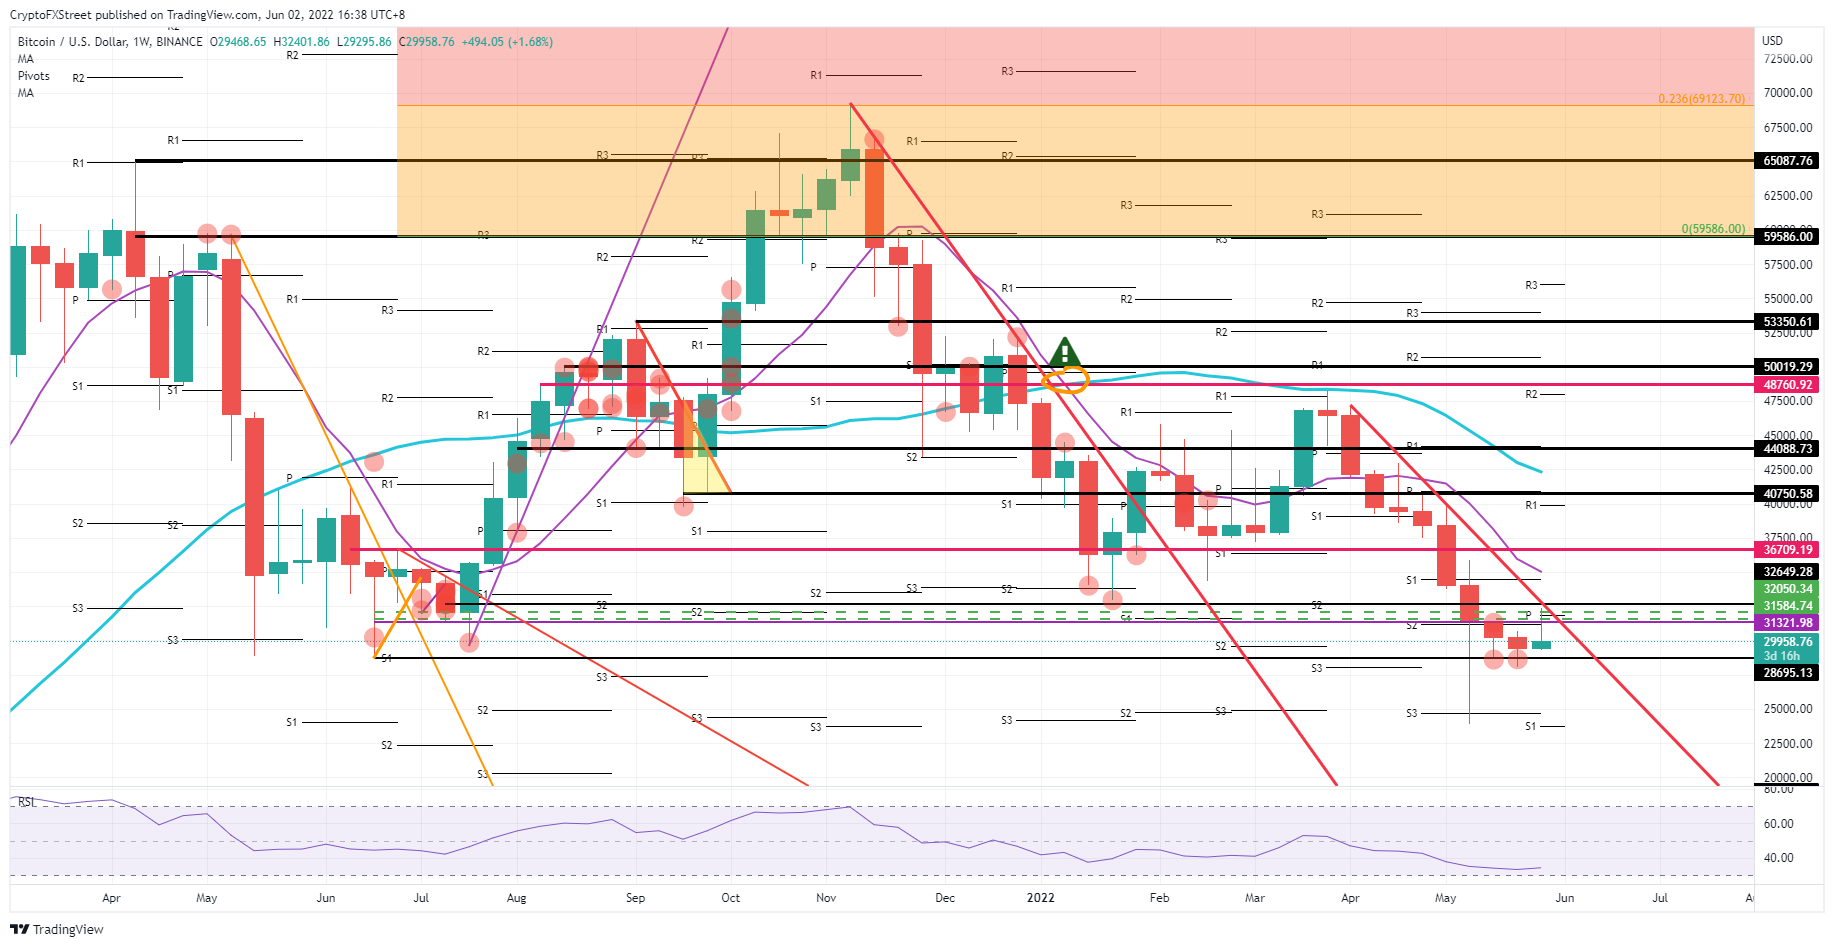
BTC/USD weekly chart
Alternatively, risks to Bitcoin price could come from the current background in global markets where traders are pulling and pushing on EUR and USD rates, causing price action to whipsaw in the eurodollar and thus bringing dollar strength on and off. That spills over into cryptocurrencies which are priced in dollars, creating similar wave patterns there. A jump in favour of dollar strength could spill over into BTC price forcing it to drop below $28,695.13 and reach $25,000.
Ethereum price still in distribution phase as bulls get a taste of a breakout
Ethereum (ETH) price is trading nicely along a distribution zone marked up from last year July. Since entering the zone in mid-May, the RSI has been shooting higher and trading away from the oversold area. Bulls even got a flavour of what a breakout would feel like with over 10% gains in the last week of May alone. Although the price pared back, it was not enough to trigger bulls to make the same trade again.
ETH price is set to scope up again to between $1,688 and $1,928 as buy-side demand enlarges. Once back above the distribution zone a jump to the new monthly pivot at $2,200 would coincide with a test against the red descending trend line. Expect that once that is broken to the upside, to see a massive inflow of bulls and investors, which will dry-up the demand supply and see a massive rally materialising all the way towards $3,000.
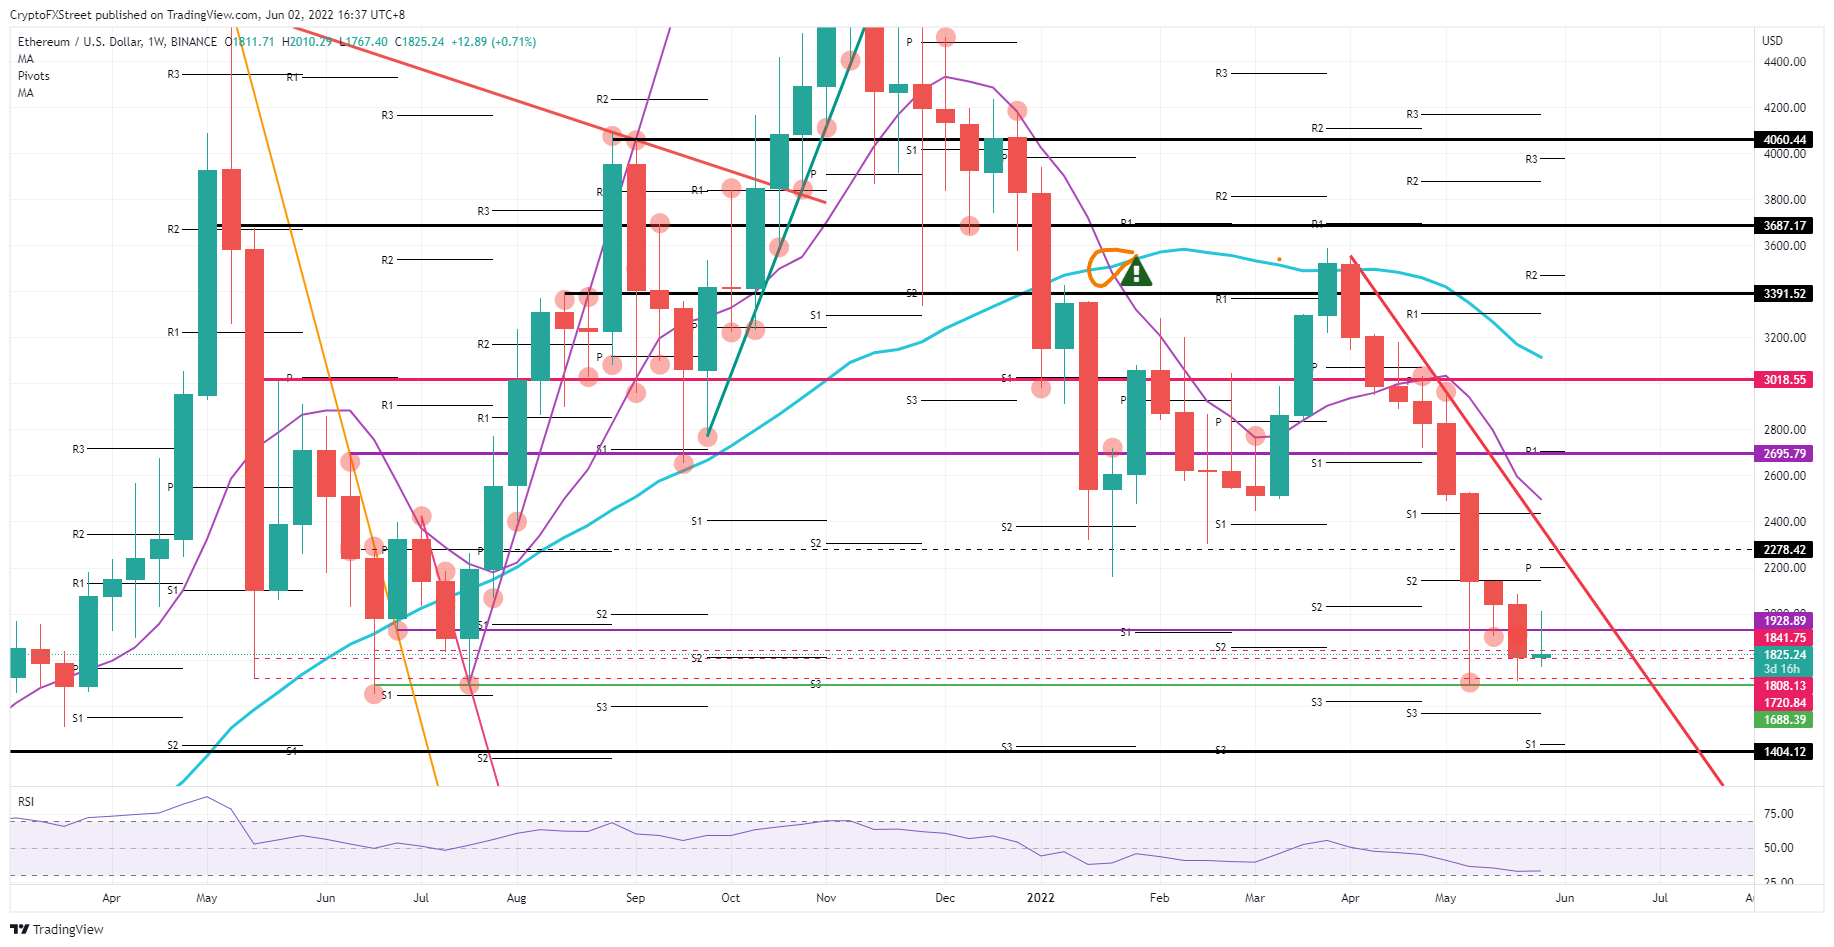
ETH/USD weekly chart
Yet bearish signals must not be ignored as they are still technically in the driving seat. It is unlikely bears will fold on their positions that easily and they could wait for the right moment to catch bulls and squeeze them out of their positions via a bull trap or another quick reversal on a crucial, pivotal level. With bulls then forced to switch sides and sell their stake, selling pressure could mount and make ETH price drop towards $1,404, printing 22% losses from today's price.
XRP price is looking for support as new monthly pivots are diverging
Ripple (XRP) price is puzzling traders as with a new month, the monthly pivots have also recalibrated and shifted position. After a pretty volatile month, this month's pivots are further away, leaving the current price action at the mercy of either the red descending trend line or the floor at $0.3616. Expect XRP price to go a little bit lower still, before a catalyst shows up that could spark a rally towards $0.50.
XRP price has been very much dependent on the monthly pivots, as proven in the price action in April and May, where respect was shown each time price touched a pivot level. The nearest pivot now is at $0.47, above the descending trend line and thus points to a possible breakout. Such a breakout could come from several headlines pointing towards ongoing talks between Russia and Ukraine with a possible breakthrough at any moment; which could see a pop in XRP price towards $0.50.
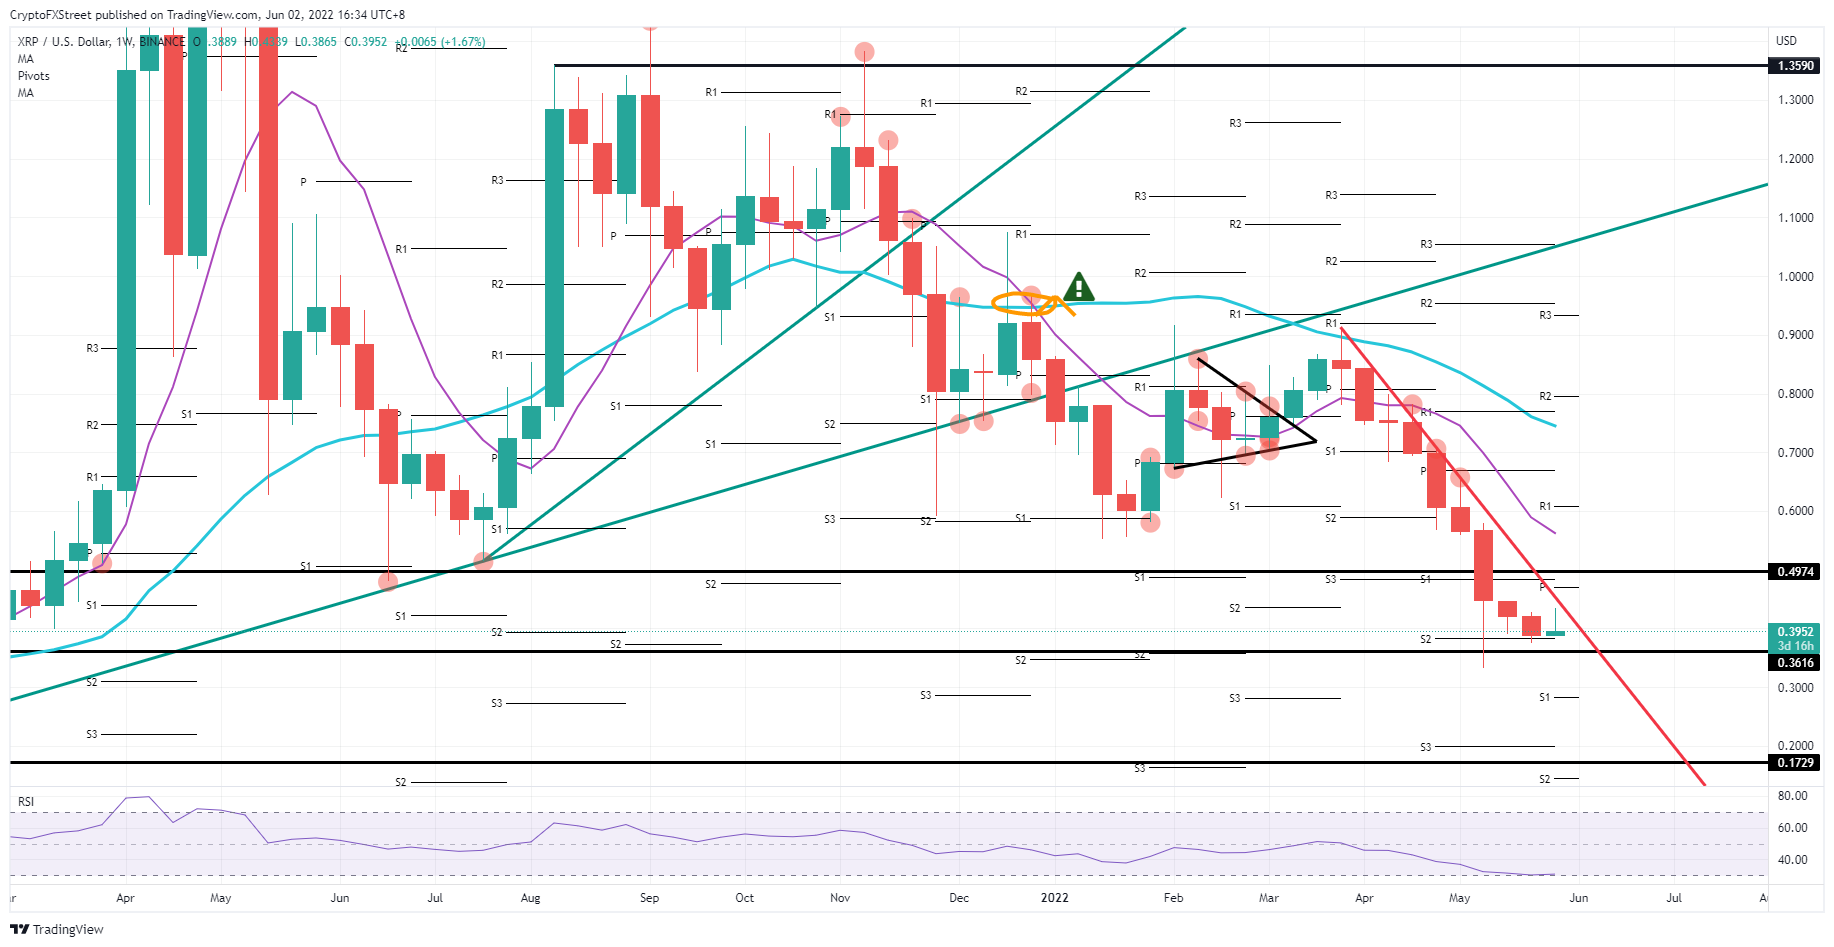
XRP/USD weekly chart
There is also the risk of harmful news headlines crossing the wires, with a considerable risk from OPEC+ expelling Russia, thus further isolating the country. That would bring another wave of risk-off and could be enough to make XRP price trip below $0.36. towards $0.29 – below the $0.30 marker at the monthly S1 support. That would mean that XRP price is at risk of losing another 30% of its value.
Author

Filip Lagaart
FXStreet
Filip Lagaart is a former sales/trader with over 15 years of financial markets expertise under its belt.


