Top 3 Price Prediction Bitcoin, Ethereum, Ripple: Assessing bullrun landing zones
- Bitcoin price faces resistance at $22,000 and might be setting up for a steeper decline.
- Ethereum price could fall toward $1,300 if the $1,600 zone continues to deny passage.
- Ripple price fails to hurdle the $0.40 barrier, which sets up a 10% swing to the downside.

The crypto market remains elevated post-rally, but the bearish persistence could induce a steeper decline. Key levels have been defined to determine potential landing zones for the Top 3 cryptocurrencies.
Bitcoin price begins to pull back
Bitcoin price currently trades at $20,750 as a profit-taking consolidation has brought calm to the buying frenzy witnessed throughout the month. To recap, the peer-to-peer digital currency is up 25% since January 1.
The Relative Strength Index (RSI), an indicator used to gauge trend potential, shows the current rally in overbought conditions on the daily time frame. The indicator is now re-routing south to test previous resistance zones for potential support. The areas of interest would be the recently breached pivot point at $18,250, which aligns with the 21-day simple moving average (SMA). The second area of interest could be the psychological $17,000 barrier if the moving indicator does not hold.
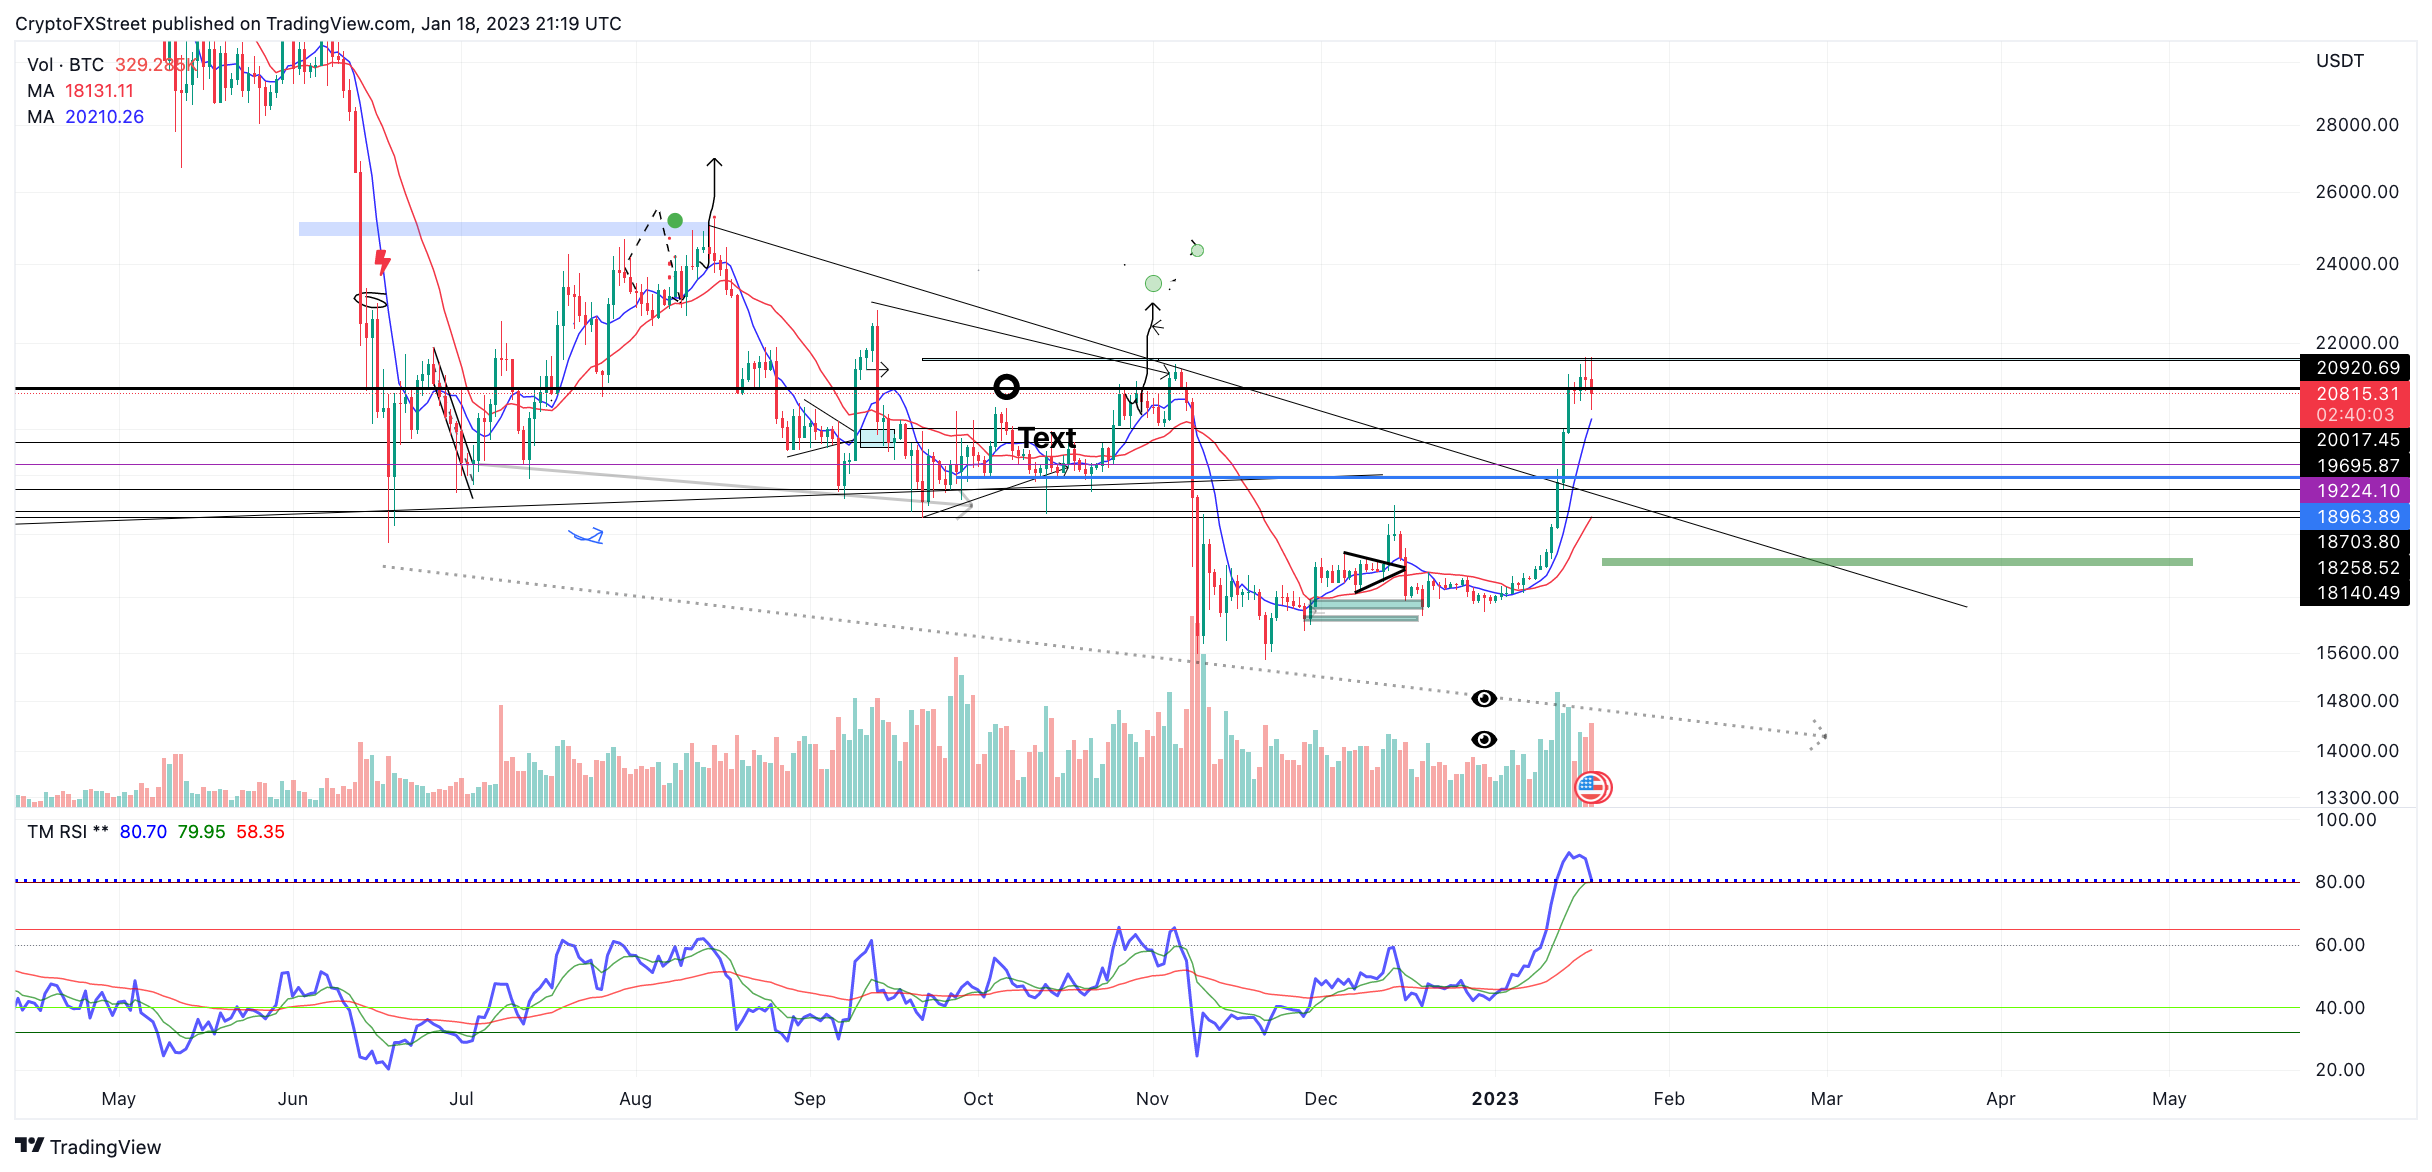
BTC/USDT 1-day chart
A third breach above the $21,550 resistance level would invalidate the bearish scenario. The bulls could then challenge the liquidity above the September high at $22,799, resulting in a 10% increase from Bitcoin’s current market value.
Ethereum price continuation depends on support
Ethereum price currently auctions at $1,526 as the bears have induced a 3% decline on the day. Similar to BTC, the RSI for the altcoin king remains elevated after breaching overbought conditions and is also testing previous levels of support. At the time of writing, the decentralized smart-contract token is witnessing its first engagement with the 8-day exponential moving average (EMA) post-rally.
If the indicator holds, the smart contract token’s next bullish target will be the untested November high at $1,680.The bullish scenario creates the potential for a 10% upswing from ETH’s current market value.
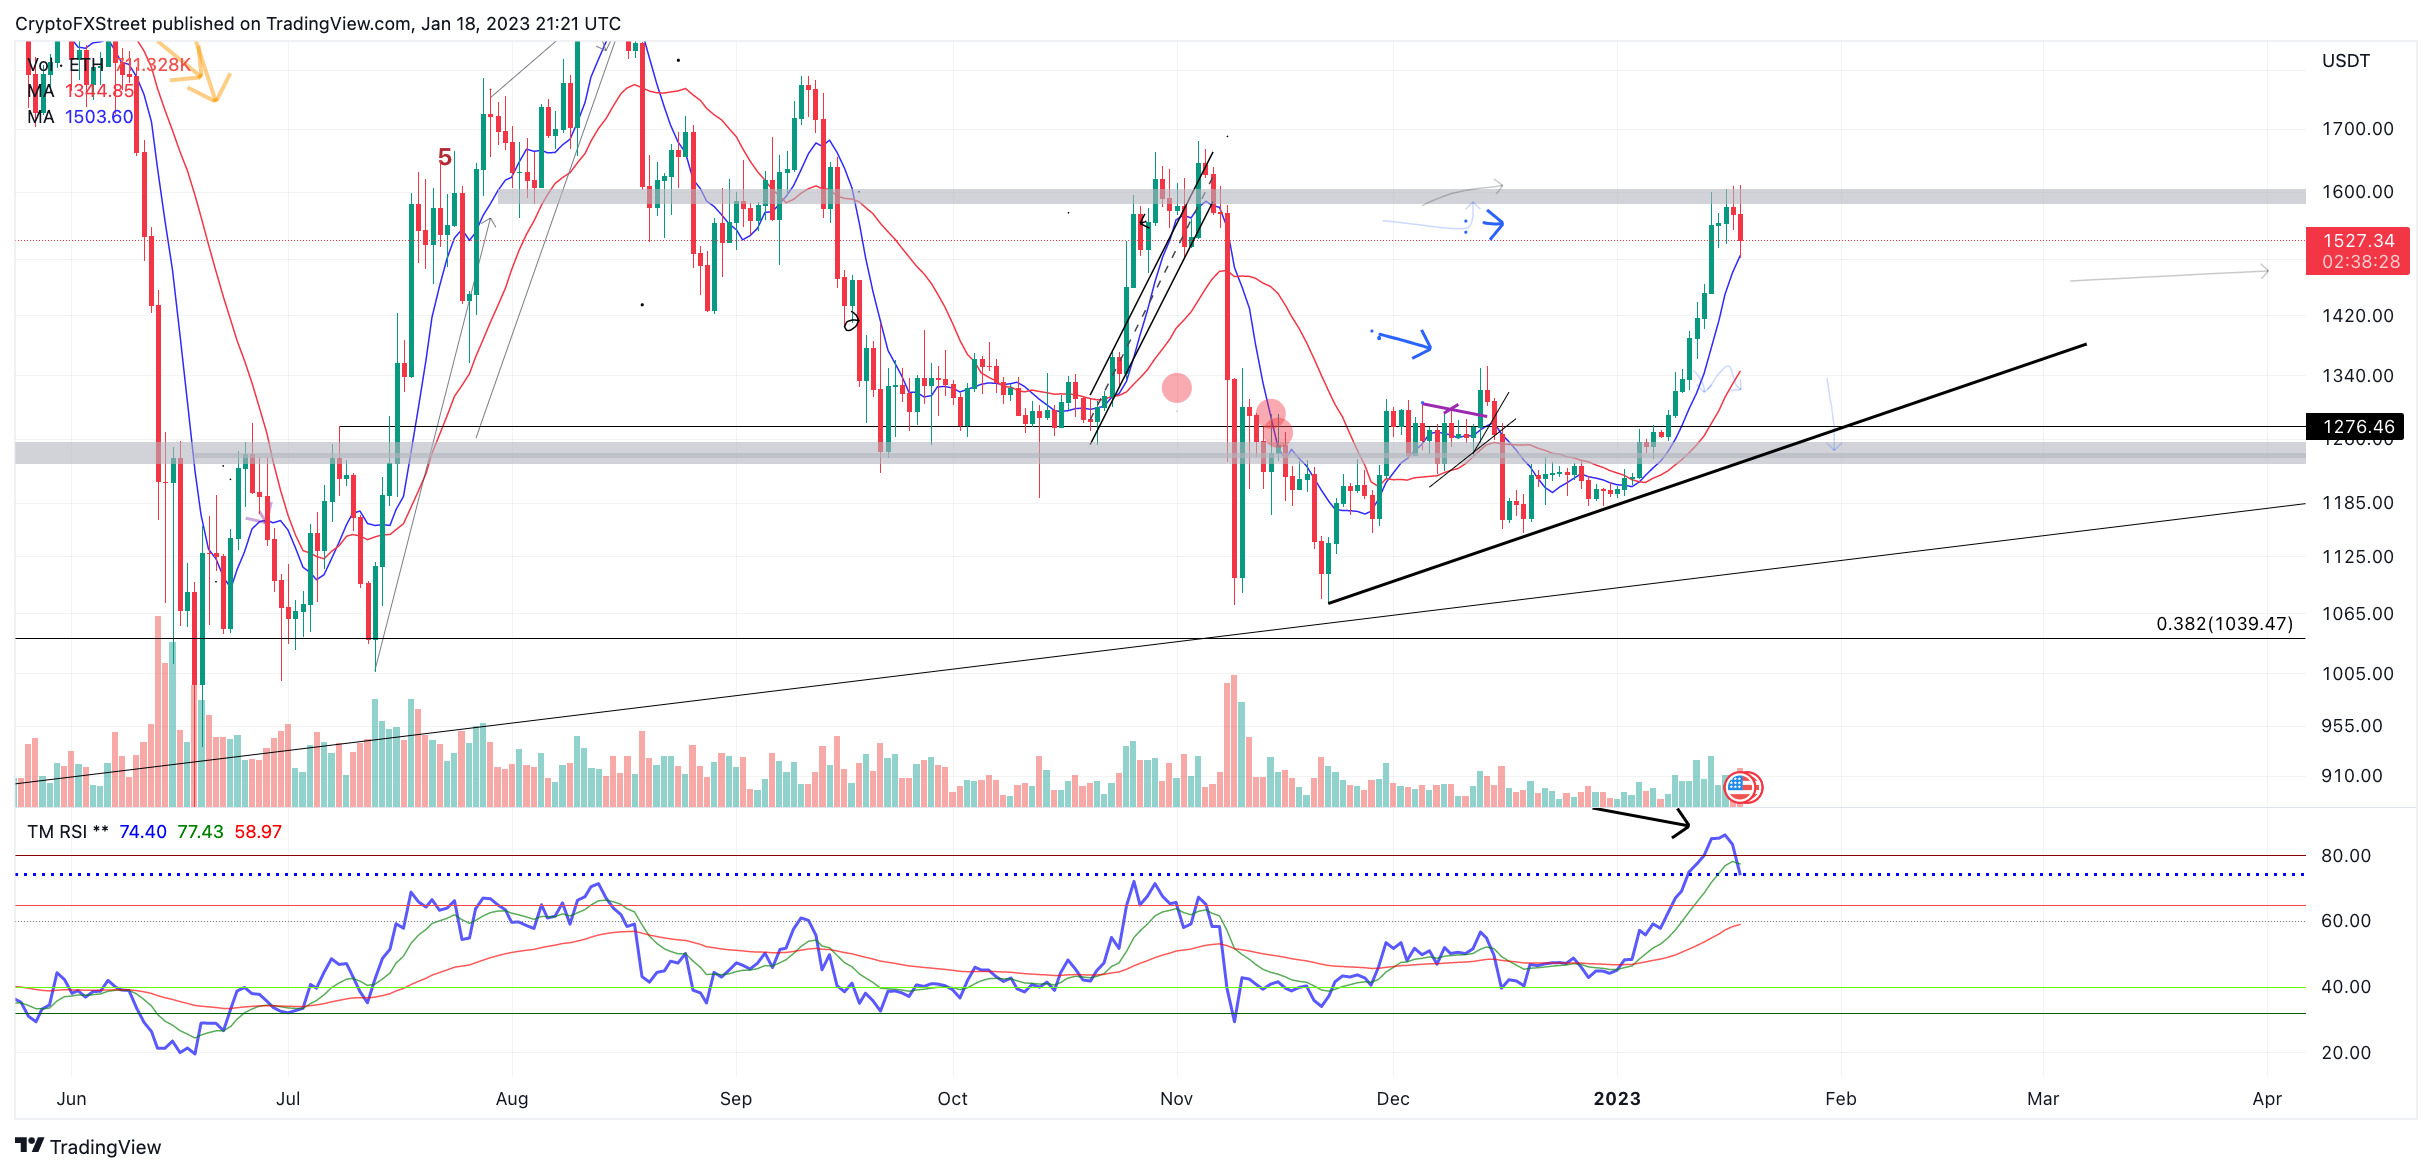
ETH/USDT 1-day chart
On the contrary, a breach through the aforementioned indicator positioned at $1,506 could induce a steeper decline. Key levels of support would be the $1,340 swing point and potentially the $ 2,80 zone, which catalyzed the influx of volume during ETH’s beginning stages of the 33% rally this month.
Ripple price facing resistance
Ripple price continues to struggle near the $0.40 zone. Following the 27% hike in the month, the digital remittance token has gone into consolidation mode, ricocheting back and forth between $0.39 and $0.40. On January 18, the bulls lost their footing, enabling a plummet into the $0.38 zone.
XRP price currently auctions at $0.383. Although the fluctuations have been minuscule in terms of percentage swings, the technicals suggest that the bulls in the market may be due to a challenge of lower support zones. The bears have pierced the 8-day EMA for the third time this week. The fourth will likely be the catalyst of a steeper decline. Bearish targets will be the 21-day SMA at $0.357 and potentially the mid $0.34 zone, resulting in up to a 10% decline from the Ripple price today.
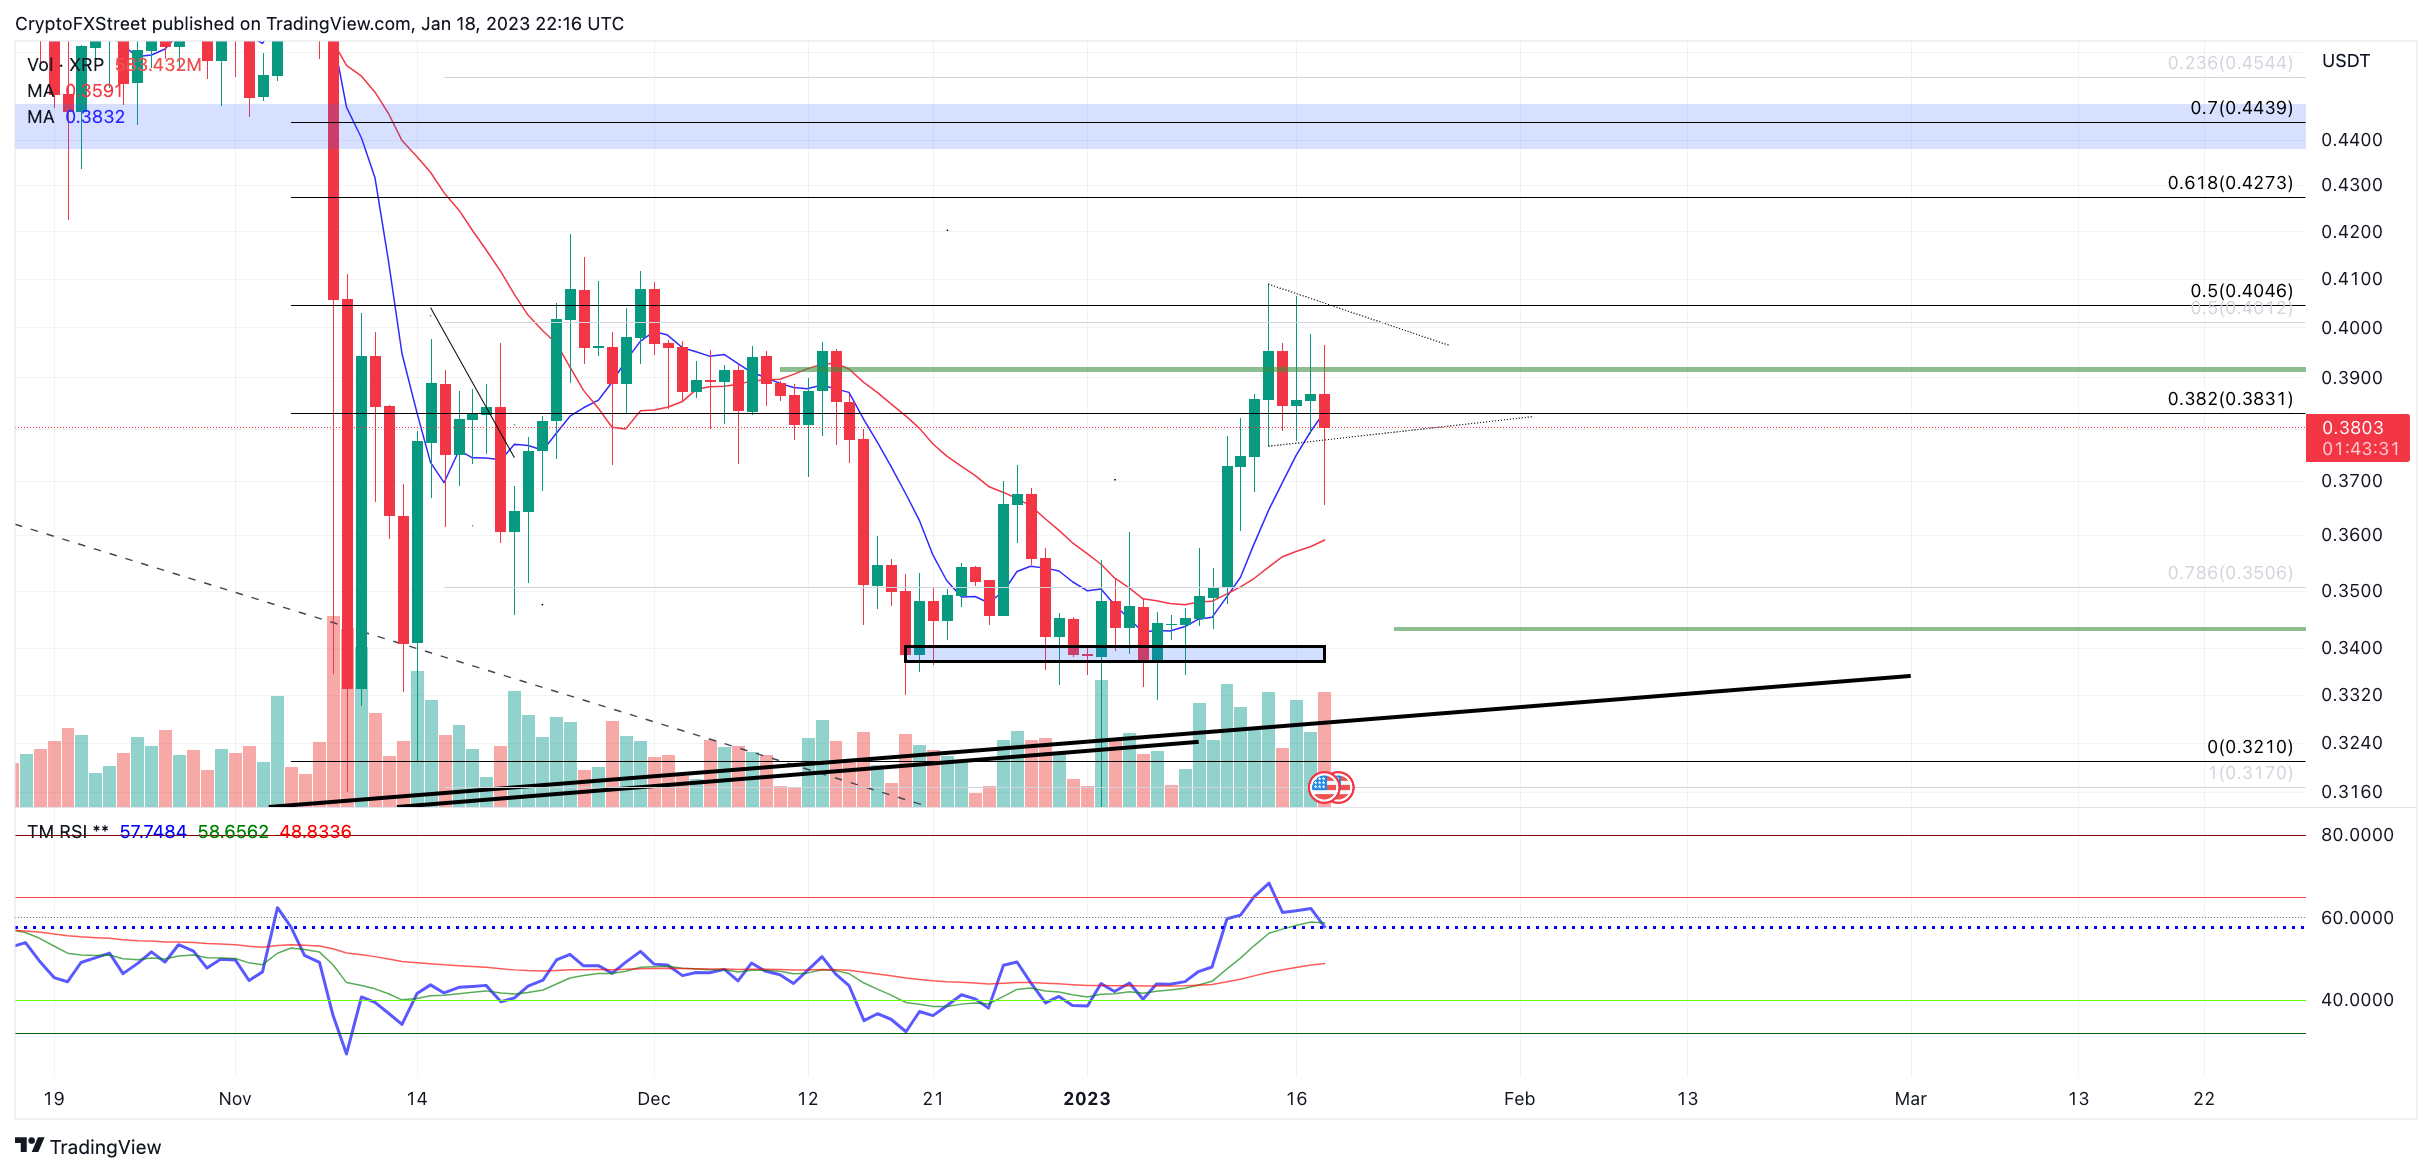
XRP/USDT 1-day chart
Invalidation of the bearish thesis could arise from a breach above the $0.405 swing highs. A hurdle of the resistant zones could induce an upswing toward November’s broken support zone at $0.44, resulting in a 16% incline from the current XRP price.
Author

Tony M.
FXStreet Contributor
Tony Montpeirous began investing in cryptocurrencies in 2017. His trading style incorporates Elliot Wave, Auction Market Theory, Fibonacci and price action as the cornerstone of his technical analysis.


