Uniswap price bulls might hold the upper hand despite recent pullback
- Uniswap price is down 12% from daily highs to lows.
- UNI could rise toward $9.95 in the coming weeks.
- A breach below $4.95 would void the bullish trend.

Uniswap prices are testing support after last week’s 25% surge. Time will tell if the bulls can sustain their presence or if bears will forge a much larger decline.
Uniswap price testing the threshold
Uniswap price has fallen by 12% after an early morning move to the upside was abruptly halted. Now, as day trading bears enter the market, investors with a long-term outlook are forced to evaluate their positions and risk moving forward.
Uniswap price currently auctions at $6.30. On smaller time frames, the bears have established a pierce through the 8-day exponential moving average (EMA), which is the initial sign that a market reversal could be underway.
The Relative Strength Index (RSI), an indicator used to assess market behavior by comparing and contrasting previous swing points, shows UNI’s recent uptrend spike breaching overbought conditions and reaching 75 on the RSI. The indicator essentially means that the bullish uptrend is genuine and stands a fair chance of being the start of a much larger rally. At the time of writing, the bearish decline is retesting a crucial level on the RSI, which could be a buy opportunity for investors with an optimistic eye.
Still, the move south is only the first barrier of support being tested. The second level would be the 21-day simple moving average (SMA) at $5.77. A test of the latter would result in an additional 8% of UNI’s current market value. Both moving averages could be used as a dollar-cost-average entry to bring the investors’ average entry price of UNI down in anticipation of another surge to the upside.
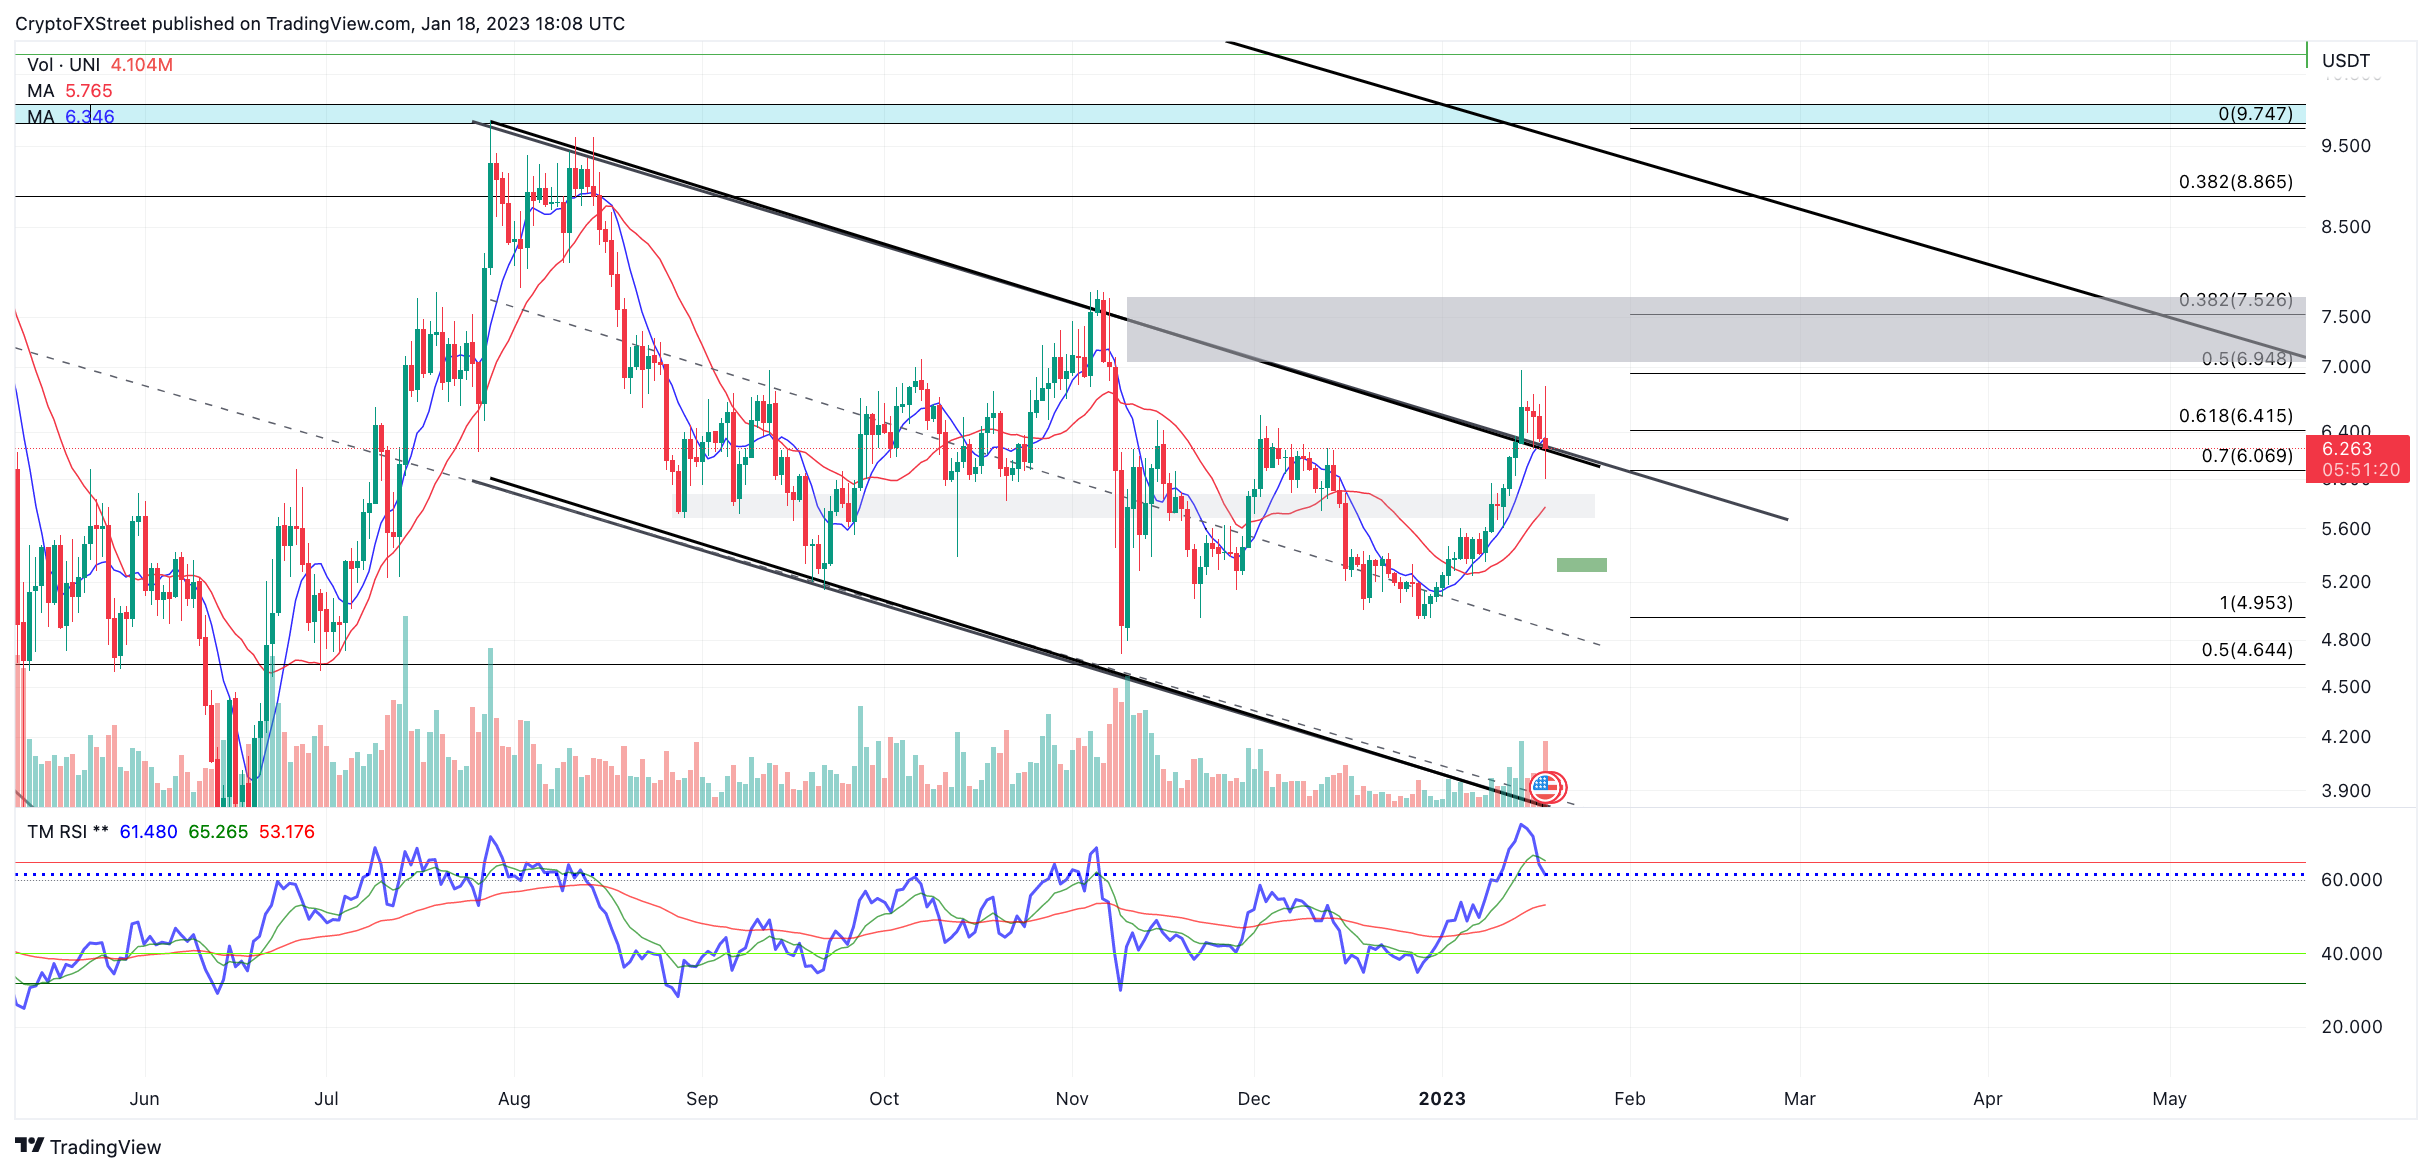
UNI/USDT 1-day chart
Based on previous outlooks and the RSI’s uptrend, the Uniswap price could rally as high as $9.95 in the coming weeks, resulting in a 60% increase from current auctioning price. The uptrend’s health depends on the December 30 swing low at $4.95 remaining untagged.
Author

Tony M.
FXStreet Contributor
Tony Montpeirous began investing in cryptocurrencies in 2017. His trading style incorporates Elliot Wave, Auction Market Theory, Fibonacci and price action as the cornerstone of his technical analysis.




