Top 3 Price Prediction Bitcoin, Ethereum, Ripple: Don’t miss the ship from fear of wet feet
- Bitcoin price maintains its bullish stance above $20,000.
- Ethereum price aims for $1,700 as a short-term target.
- u\XRP price forms a strong bullish reversal pattern on the weekly time frame.

The crypto market remains elevated after an incredible first leg up. Now a pause in price action is giving traders time to consider if they want to go on the offensive or remain sidelined.
Bitcoin price takes a turn for the better
Bitcoin price currently auctions at $20,850 as the digital asset is witnessing its first prolonged pause after seven consecutive days of positive returns. The peer-to-peer digital currency digital asset could be on its way toward the level of the 200-week Exponential Moving Average (EMA) at $24,490. A tag of the barrier would constitute an additional 20% uptrend gain move from the BTC price today.
The 3-day chart, which combines three days of market history into one candlestick, shows a strong bullish engulfing candle with an 11 % rise on January 13. The candlestick representing the current price action has not retraced the previous candlestick by 50%, which is a subtle gesture of bullish strength. Traders aiming for the 200-week EMA could use the low of the 3-day candle stick as a short-term invalidation point.
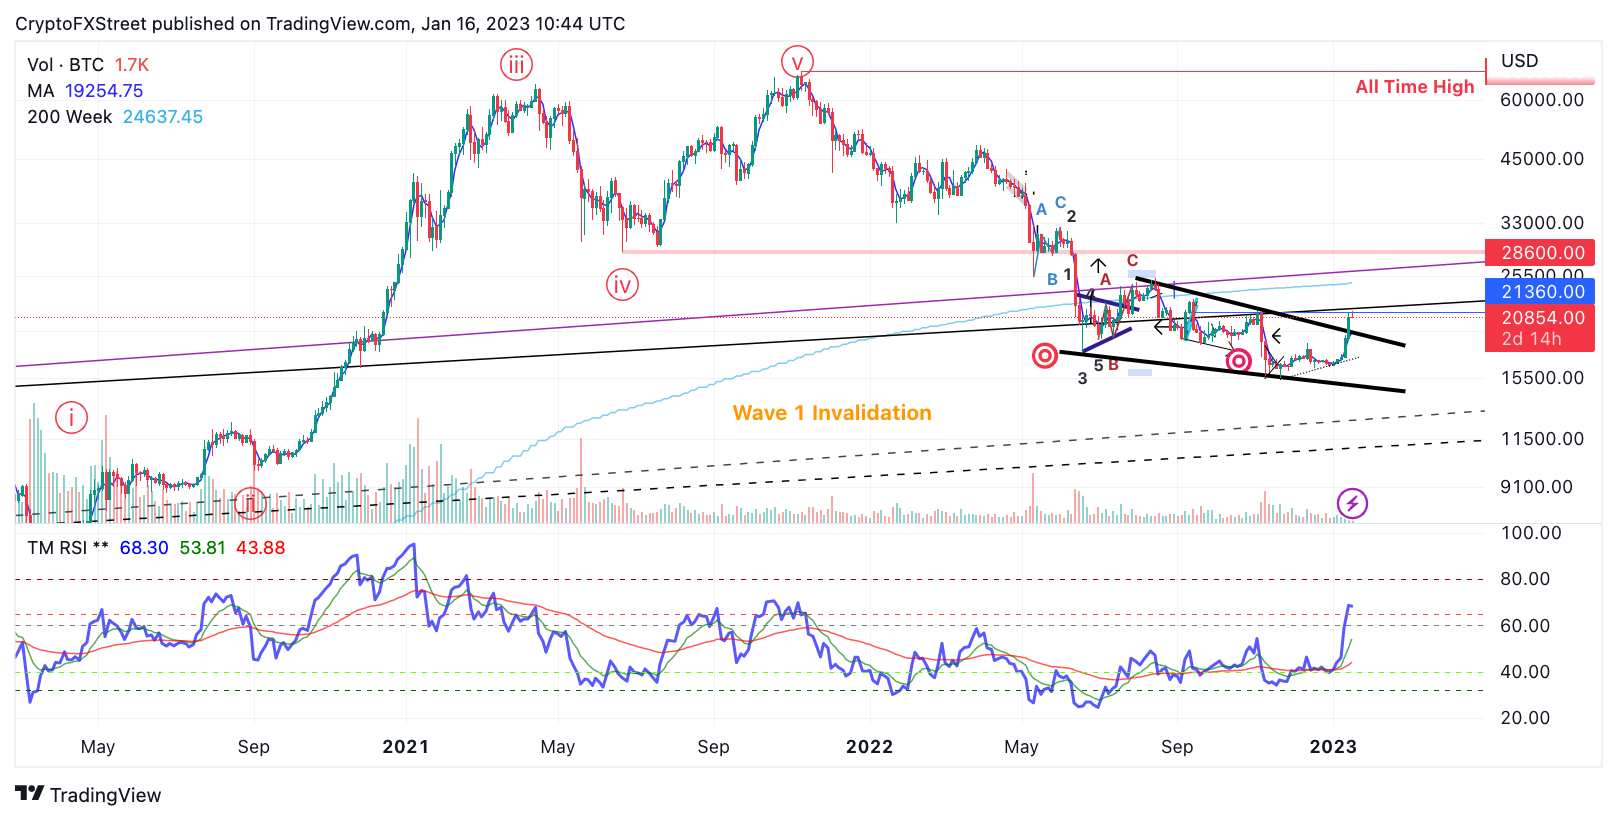
BTC/USDT 1-Day Chart
A breach of the 3-day candlestick low at $18,720 could trigger a cascade of selling to challenge newly established bulls. The $17,000 barrier, which acted as resistance throughout the fall, could be subject to a breach resulting and if so, it would probably trigger a 14% decline from BTC's current market value.
Ethereum price catches its breath
Ethereum price has also halted the bullish momentum that witnessed a 30% rally since January 1. Two weeks later, the ETH price stands erected within the mid-$1,500 zone, having hurdled 80% off from November's trading range.
Ethereum price currently auctions at $1540. The next key area for the decentralized smart-contract token to conquer is November's high at $1,680 and potentially the September top at $1,789. The bullish scenario creates space for up to a 17% rise from ETH's current market value.
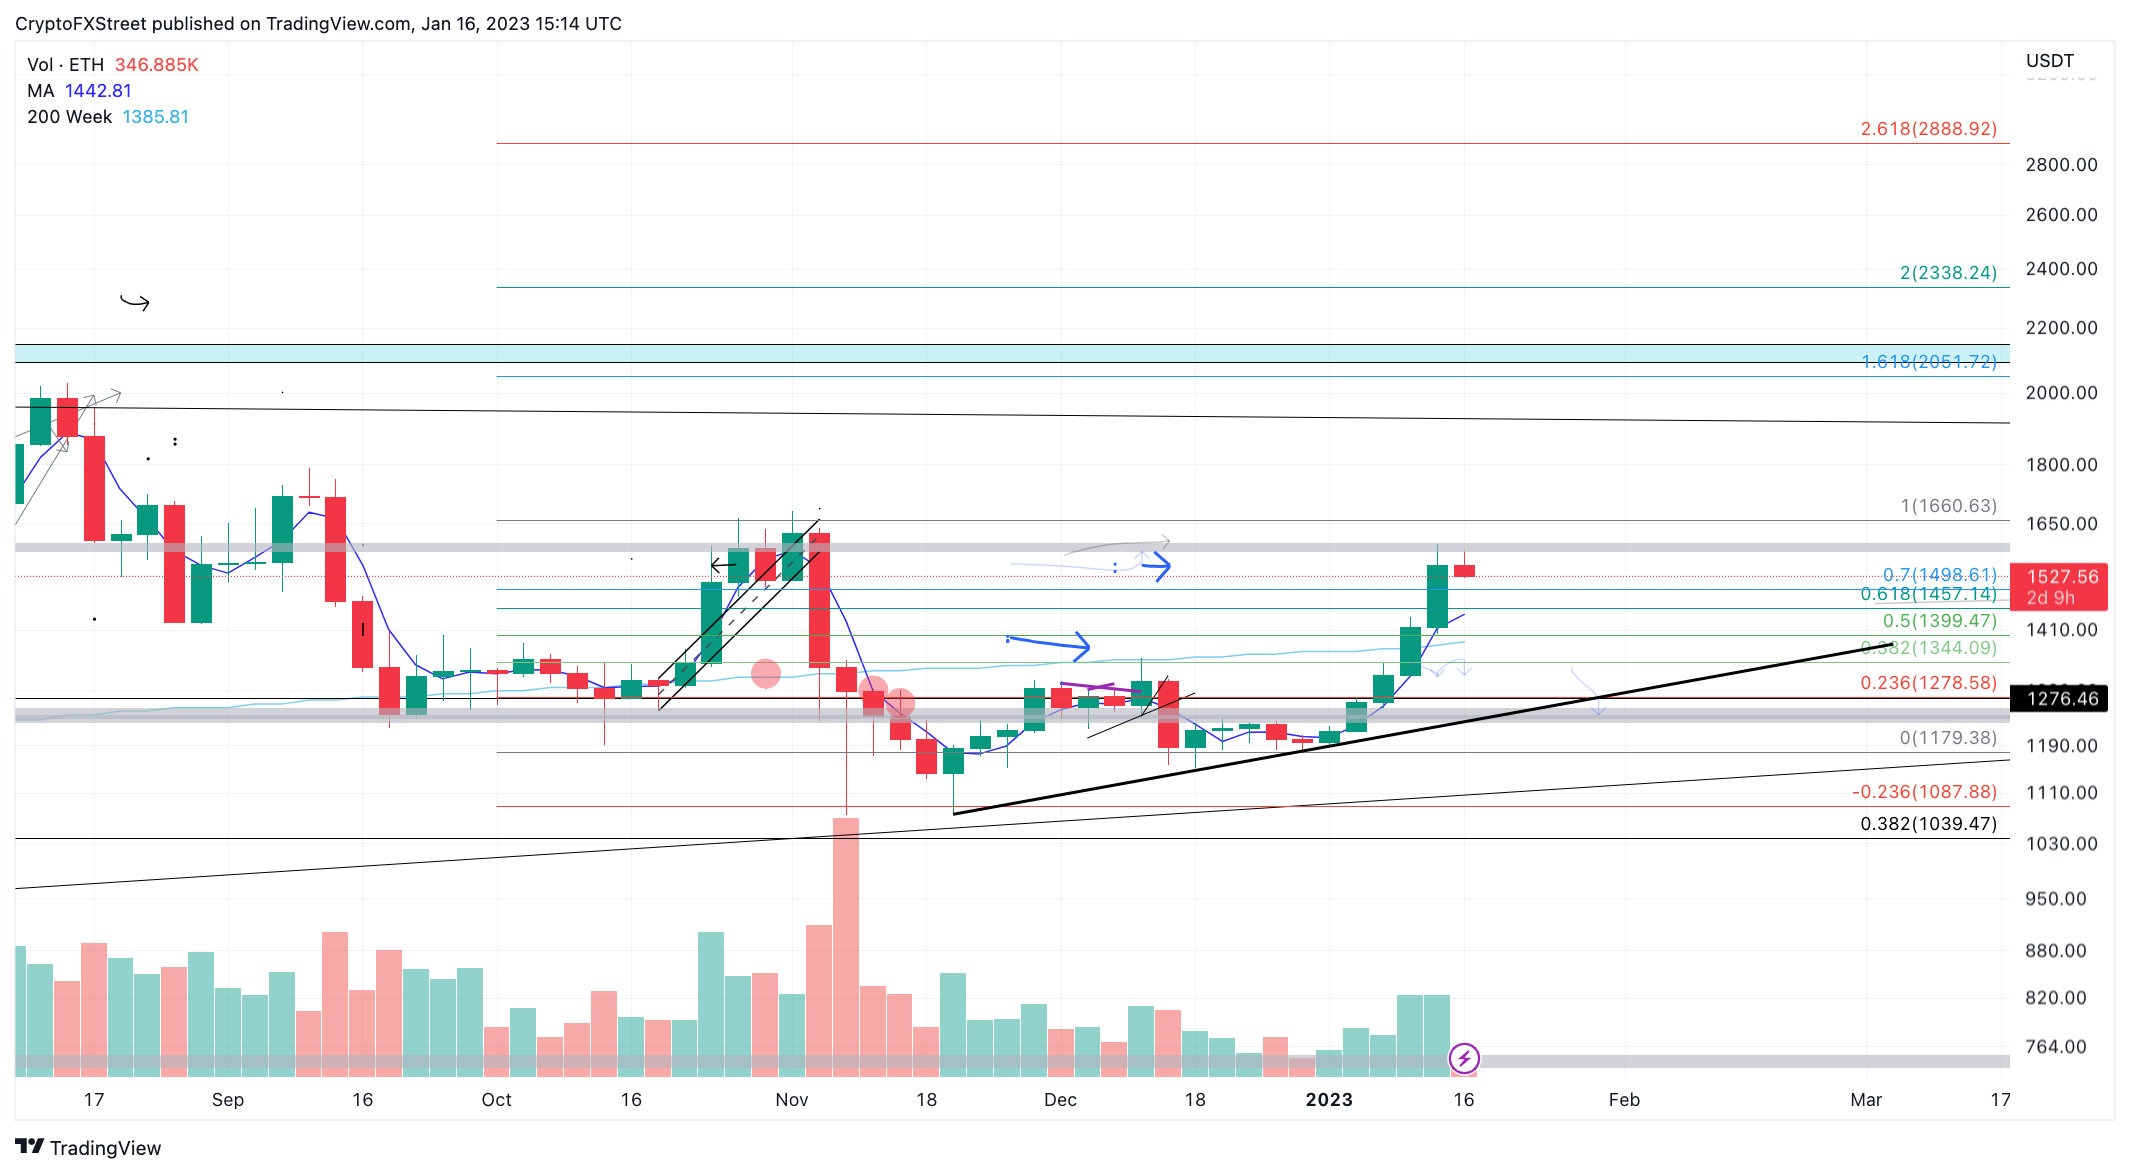
ETH/USDT 3-Day Chart
Unlike Bitcoin, the Ethereum price has already breached the 200-week EMA and a retest of the indicator is expected to occur. Traders looking to join the trend may be able to use the low of the candlestick that breached the barrier as an invalidation point at $1,316. Keep in mind this is a high-risk trade idea, and a much deep reversal targeting the $1,230 liquidity could occur if the level is breached.
XRP price tags $0.40
XRP price rose by 20% last week after briefly tagging the $0.40 barrier. The surge enabled bulls to establish a classic morning star candlestick pattern on the weekly time frame, with confirmation. A morning star pattern is a three-candlestick reversal signal. The farthest to the left is usually a strong bearish candle in favor of the larger trend. The middle candle represents the reversal from the trough lows. The final candle to the right provides confirmation of a market pivot and is the catalyst of the reversal, especially if it hurdles the previous candle, as is the case with the XRP price. In Ripple’s case, the reversal is extra strong as not only did the third candle hurdle the prior week, but it also closed higher than the high of the bearish candlestick to the far left as well.
XRP price currently auctions at around $0.38 as markets are showing their first consolidation post-rally. Considering the shallow pullback and factors mentioned above, there is a good chance XRP price is in the buy-zone, and primed to rise after its short correction. It could then move toward the $0.44 zone. The target is an untested liquidity level from Ripple's last decline in November. The XRP price could rise by 15% under such a bullish scenario.
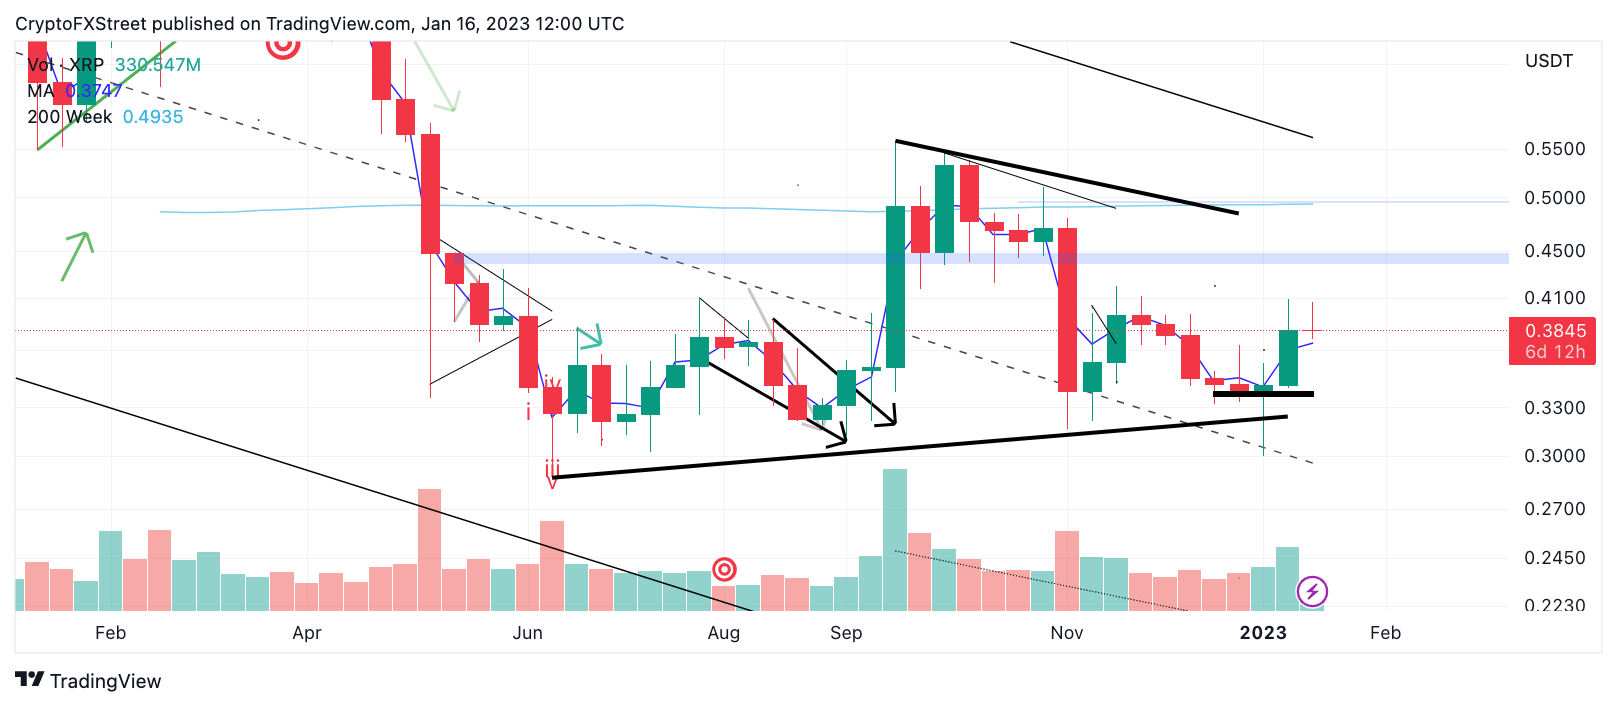
XRP/USDT 1-Week Chart
Invalidation of the uptrend could occur if the bears can tag the last week's low at $0.34. In doing so, XRP could even drop back to the $0.30 zone resulting in a 22% market decline.
Author

Tony M.
FXStreet Contributor
Tony Montpeirous began investing in cryptocurrencies in 2017. His trading style incorporates Elliot Wave, Auction Market Theory, Fibonacci and price action as the cornerstone of his technical analysis.


