Top 3 Price Prediction Bitcoin, Ethereum, Ripple: April lows could prove significant for BTC and ETH
- Bitcoin price is trading horizontally despite a 3% daily rise pivoted around the CPI inflation reading.
- Ethereum price has bowed to the BTC dominance, moving sideways as investors' CPI-provoked reaction wanes.
- Ripple price holds steady, but it all depends on whether the $0.4000 support will hold.
- Investors should probably place their sell stops around the April lows, where confirmations could manifest.

Bitcoin (BTC) price reacted positively to the US Consumer Price Index (CPI) release after the data gave a reading 0.1% below what economists had anticipated. While this indicated a "weakening dollar," it was good news for the crypto market, giving investors a breather from the bearish drag since the year's onset. Nevertheless, as the hype around the CPI inflation release fades, the cryptocurrency market has resumed its prior boring price action as the April lows continue to hold forte.
Also Read: Binance ‘FUD’ meets CPI – Five things to know in Bitcoin this week
Bitcoin bulls must defend the April lows
Bitcoin price turned bullish amid the CPI Inflation-related headlines, rising 3% in the last 24 hours to trade at $28,257 at the time of writing. However, as is the norm, BTC has returned to its previous boring price action because it lacks a significant catalyst to extend the rally.
In the absence of a bullish catalyst, Bitcoin price has not been able to rise above the uptrend line it fell below on May 7. The overall outlook remains bearish, which means BTC bulls must defend the April lows around $27,221 at all costs.
If early profit-taking kicks in because traders want to break even, Bitcoin could lose all the gains made on May 10 and fall below the $27,221 support level. A fall below this base could deliver BTC to the $26,191 support level due to the 100-day Exponential Moving Average (EMA).
In a dire case, the Bitcoin price could fall under $25K, tagging the support provided by the 200-day EMA at $24,666. Such a move would denote a 10% downswing.
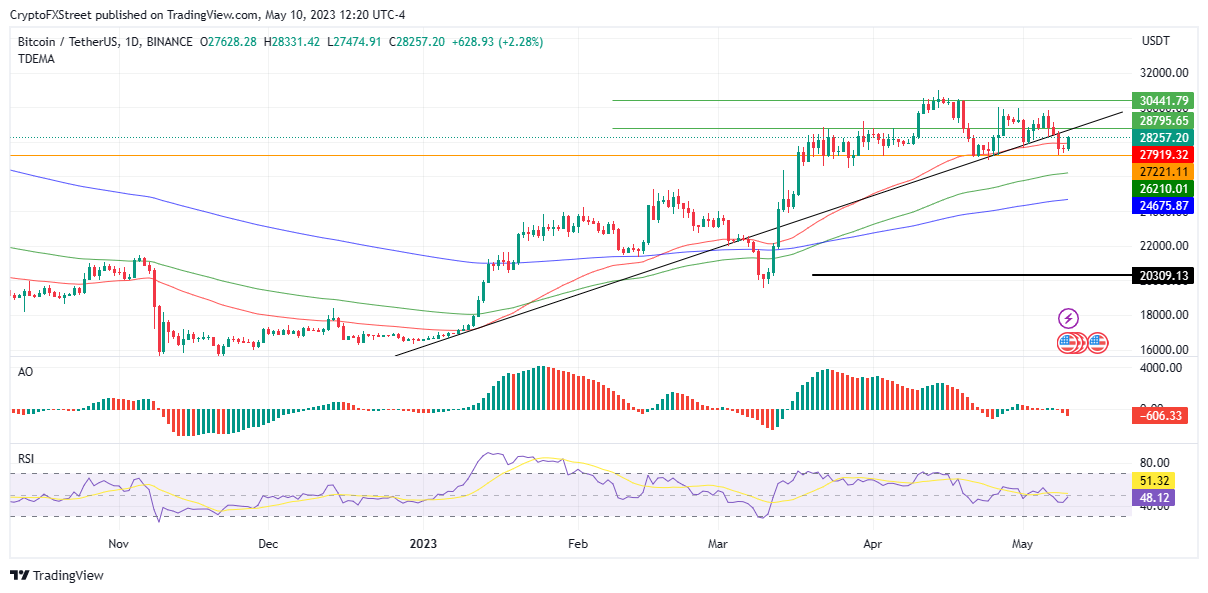
BTC/USDT 1-Day Chart
On the flipside, investors keeping their greed in check and doubling their buying effort could set the pace for Bitcoin price to rise further. A restoration above the uptrend line at $28,795 could put BTC on a path to more gains. Nevertheless, the bearish thesis would only be invalidated upon a daily candlestick close above the $30,441 resistance level.
Also Read: Bitcoin, Ethereum prices rally as US CPI inflation falls to 4.9%
Ethereum price waits for the BTC cue
Ethereum price is bearish, displaying five consecutive red bars as ETH resumes the negative stance seen before the CPI reading. Accordingly, like the flagship crypto, the April lows around $1,791 are critical in determining the next move.
An increase in seller momentum could see ETH drop below the critical support at $1,791, opening the drains for further losses. Possible turnaround points for Ethereum price would be around $1,760 or $1,687, marked by the 100- and 200-day EMA, respectively. These areas were support levels where sidelined investors were gathered. Failure of these suppliers to buy ETH could see the Proof-of-Stake (PoS) token revisit the March 12 lows around $1,459.
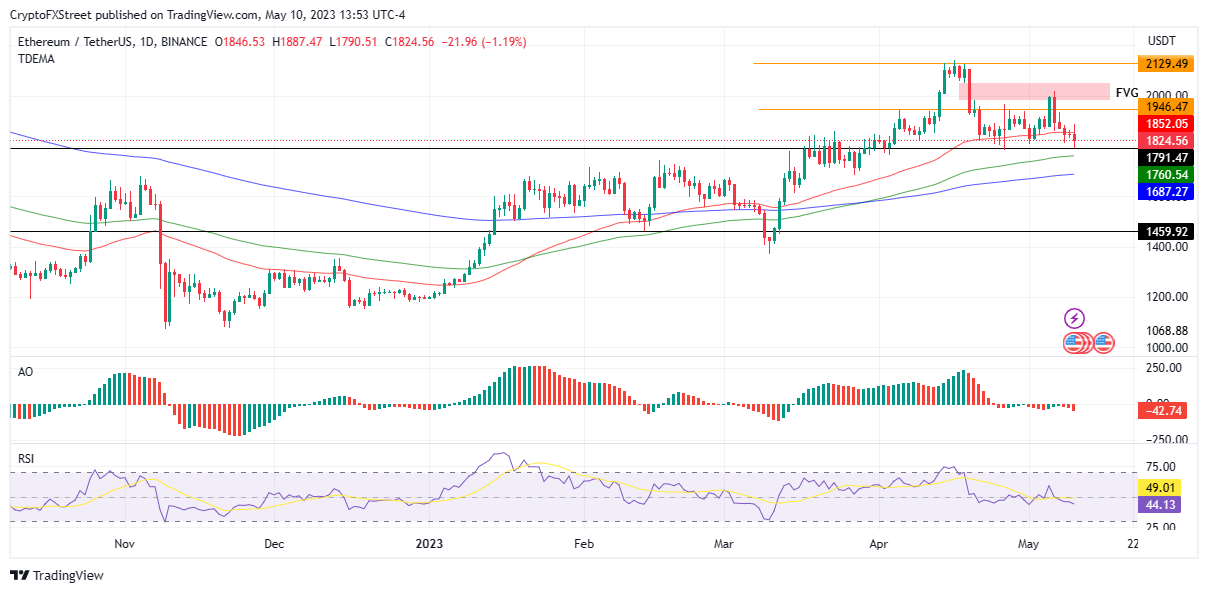
ETH/USDT 1-Day Chart
Conversely, there was still an imbalance in the Ethereum price action shown with a reddish Fair Value Gap (FVG) band on the daily chart. If this zone acts as a magnet, Ethereum price could bounce, first flipping the 50-day EMA at $1,852 hurdle into support and using it to target higher prices. While a rise above the $1,946 resistance level would be a good sign, the bearish outlook will only be invalidated upon a decisive candlestick close above $2,129.
Also Read: Ethereum MEV-burn upgrade could reap big rewards for investors
Ripple price could benefit from positive news
Ripple price was steady at the time of writing, holding above the $0.42 support level. Overhead pressure from the 200-, 100-, and 50-day EMA at $0.43, $0.44, and $0.46 continues to weigh down on XRP, alongside the lack of development in the Ripple v SEC case.
Weighed down by these hurdles, Ripple price could drop further, but investors should only lose hope for the short term once the price falls below the $0.40 support level. A break below this level could see the payments token revisit the mid-March lows around $0.35.
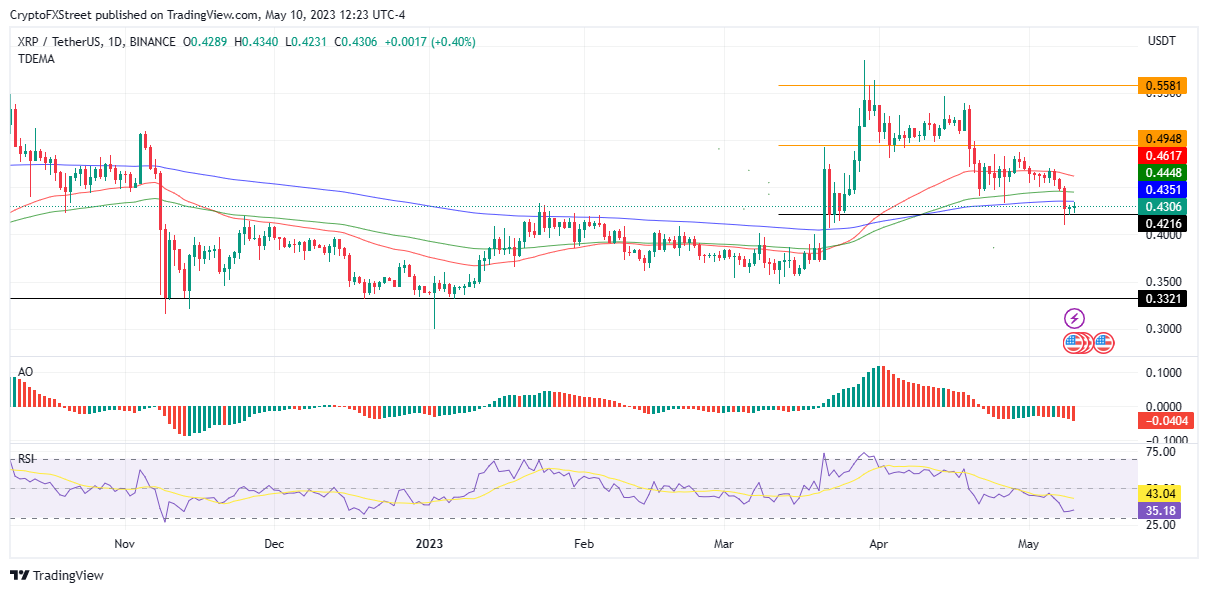
XRP/USDT 1-Day Chart
On the other hand, a bullish takeover, possibly fueled by significantly positive news in the Ripple v SEC case, could inspire a rally in Ripple price. In such a case, XRP could rise above the $0.49 resistance level or, in a highly bullish case, tag the $0.55 resistance level, where the tables would turn in favor of bulls.
Also Read: Pro-Ripple attorney says XRP could be sold as a security in primary market
Author

Lockridge Okoth
FXStreet
Lockridge is a believer in the transformative power of crypto and the blockchain industry.




