Top 3 Price Prediction Bitcoin, Ethereum and Ripple: Bitcoin tumbles as selling pressure intensifies
- Bitcoin falls to $10,400 amid the BitMEX saga with the US CFTC.
- Ethereum embarks on a downtrend eyeing $320 despite the return of regular users to the network.
- Ripple suffers another blow at $0.25, diving fast towards the critical support at $0.22.

The cryptocurrency market is still swimming in turbulent waters, even as the weekend session is ushered in. It has been a week with minor price movements, especially to the upside. The flagship cryptocurrency retreated to $10,400 on Thursday before making a quick swing above $10,600. The majority of cryptoassets followed in Bitcoin's footsteps. For instance, Ethereum revisited support at $340, while XRP slipped below $0.24. On the contrary, Ren (REN) and Balancer (BAL) rallied in the last 24 hours, supported by the listings on Coinbase Pro.
US President Donald Trump tests positive for COVID-19
The world is still dealing with the COVID-19 pandemic that has brought economies to their knees. The disease, which started in China, ravaged across the globe, infecting everyone its path; the rich, the poor, the powerful, and the weak have bowed to the monster. The United States President Donald Trump confirmed that he has tested positive for the novel virus on Friday morning. He shared the news on Twitter, assuring the world, "we will begin our quarantine and recovery process immediately. We will get through this TOGETHER."
The news of Trump testing positive comes barely weeks to the US presidential elections. It is also a moment of reckoning to most people who have not been taking the pandemic seriously, knowing that anyone can get infected.
Bitcoin bulls back to the drawing board
Bitcoin failed to break the resistance at $11,000, which left bulls exhausted and maybe a little disappointed. As buyers retreated to rejuvenate, bears capitalized on their weakest moment to push their agenda for losses to $10,000. On the bright side, the bellwether cryptocurrency held onto support at $10,400.
Meanwhile, BTC has made a minor recovery to highs above $10,600. The 50 Simple Moving Average caps the upside. Buyers must flip the 50 SMA into support for gains targeting $10,800 and $11,000 to materialize. On the other hand, the ascending parallel channel suggests that not much damage has been done on the uptrend, yet. However, if the channel confirms a bear flag, Bitcoin might embark on the downtrend and slide towards $10,000. For now, the path of least resistance is downwards as the Relative Strength Index (RSI) slums under the midline.
BTC/USD 4-hour chart
 (39)-637372198997581012.png)
IntoTheBlock's IOMAP model highlights growing resistance on the upside. For now, the most challenging resistance lies from $10,580 to $10,890. Previously, roughly 2 million addresses bought nearly 1.4 million BTC in the range. This zone appears to have enough power to absorb most of the buying pressure, which will delay the journey to $11,000.
Bitcoin IOMAP chart
-637372199554482915.png)
On the downside, the model reveals that support has thinned massively, but the buyer congestion between $10,250 and $10,560 is likely to cushion BTC from extending declines. Previously, about 1 million addresses bought nearly 680,000 BTC in this area. However, it is essential to keep in mind that the most robust support lies between $9,308 and $9,640, as per the IOMAP model.
The sharp fall in Bitcoin is attributed to the news that the US Commodity and Futures Trading Commission (CFTC), in conjunction with other federal prosecutors, have moved forward with charges against BitMEX for facilitating the buying and selling of unregistered derivatives. Moreover, the acting Attorney for the South District of New York, Audrey Strauss, has charged BitMEX CEO, Arthur Hayes, and other firm employees for violating the Bank Secrecy Act.
Read more: Bitcoin, Ethereum and XRP plummet after CFTC accused BitMEX of evading U.S. regulations
Ethereum rejection from $370 aims for $320
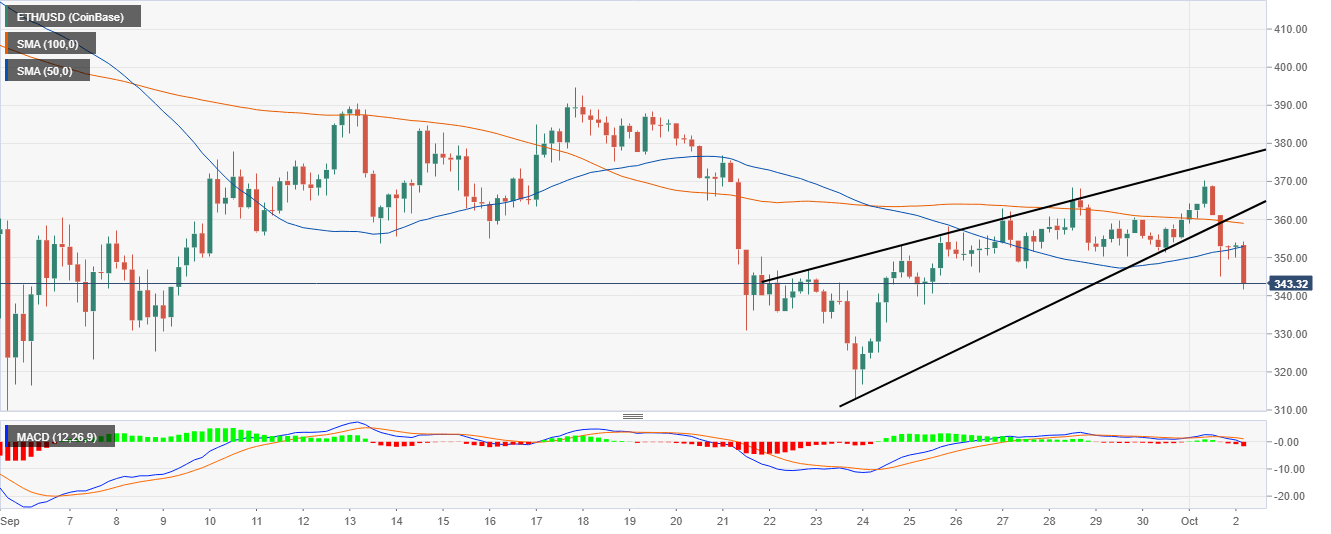
Ethereum completed the leg to $370 following a break above $360, as discussed. However, buyers run out of steam to continue with the uptrend. Bears, on the other hand, sharpened their claws, mauling Ethereum to levels below $350. At the time of writing, Ethereum is in the middle of a retreat after another rejection at the 50 SMA. If the short term support at $340 is broken, the smart contract token will start exploring the rabbit hole back to $320. The downtrend is highlighted by the Moving Average Convergence Divergence (MACD) as it dips into the negative region while widening the bearish divergence.
ETH/USD 4-hour chart
According to IntoTheBlock's IOMAP model, Ether has a clear path to $300 due to a lack of significant support. The most formidable support lies between $292 and $302. Here, roughly 1 million addresses bought 2.6 million ETH. On the upside, the road to recovery looks impassable, especially with buyers' immense concentration between $343 and $353. Here, nearly 403,000 addresses bought 9.45 million ETH. The selling pressure ahead of Ethereum is very intense; hence the path of least hurdles is downwards.
Ethereum IOMAP chart
-637372200209346292.png)
Despite the retreat in the price, data by Santiment shows that "regular users are returning to Ethereum in response to lower (and more affordable) transaction fees. Moreover, large non-exchange holders are rapidly accumulating, perhaps due to the anticipation surrounding the impending Ethereum 2.0 upgrade. For instance, over the last one month, these whales have increased their holdings from 11.14 million to 12.92 million ETH. The buying pressure is likely to help Ethereum reverse the ongoing downtrend and embark on the grand journey to $400.
Ethereum non-exchange holders chart
 non-exchange holders-637372201095927986.png)
Ripple's breakdown eyes $0.22
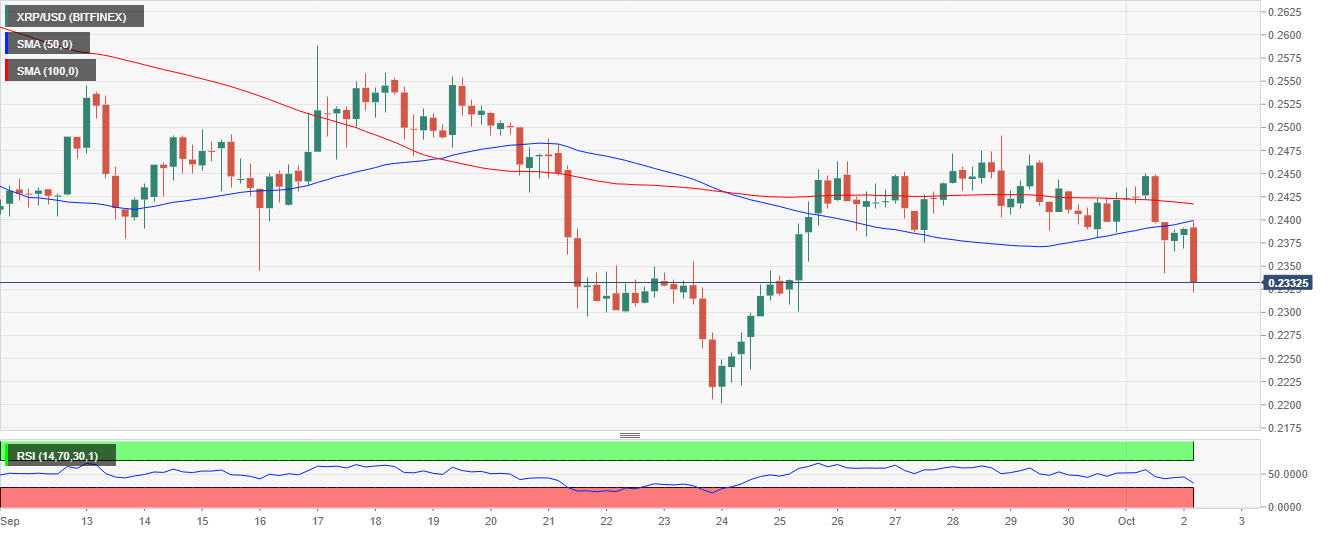
The cross-border cryptocurrency has tried its best to hit levels at $0.25 to no avail—resistance between $0.245 and $0.2475 drained the buyers leaving them exhausted. The selling pressure across the market took advantage of a weak bullish camp, forcing XRP towards $0.23. At the moment, XRP is trading at $0.233 amid a growing bearish grip. The Relative Strength Index (RSI) currently emphasizes the downtrend likely to hit lower levels at $0.22. The support at $0.23 is in line to absorb some of the selling pressure, which might invalidate the expected breakdown.
XRP/USD price chart
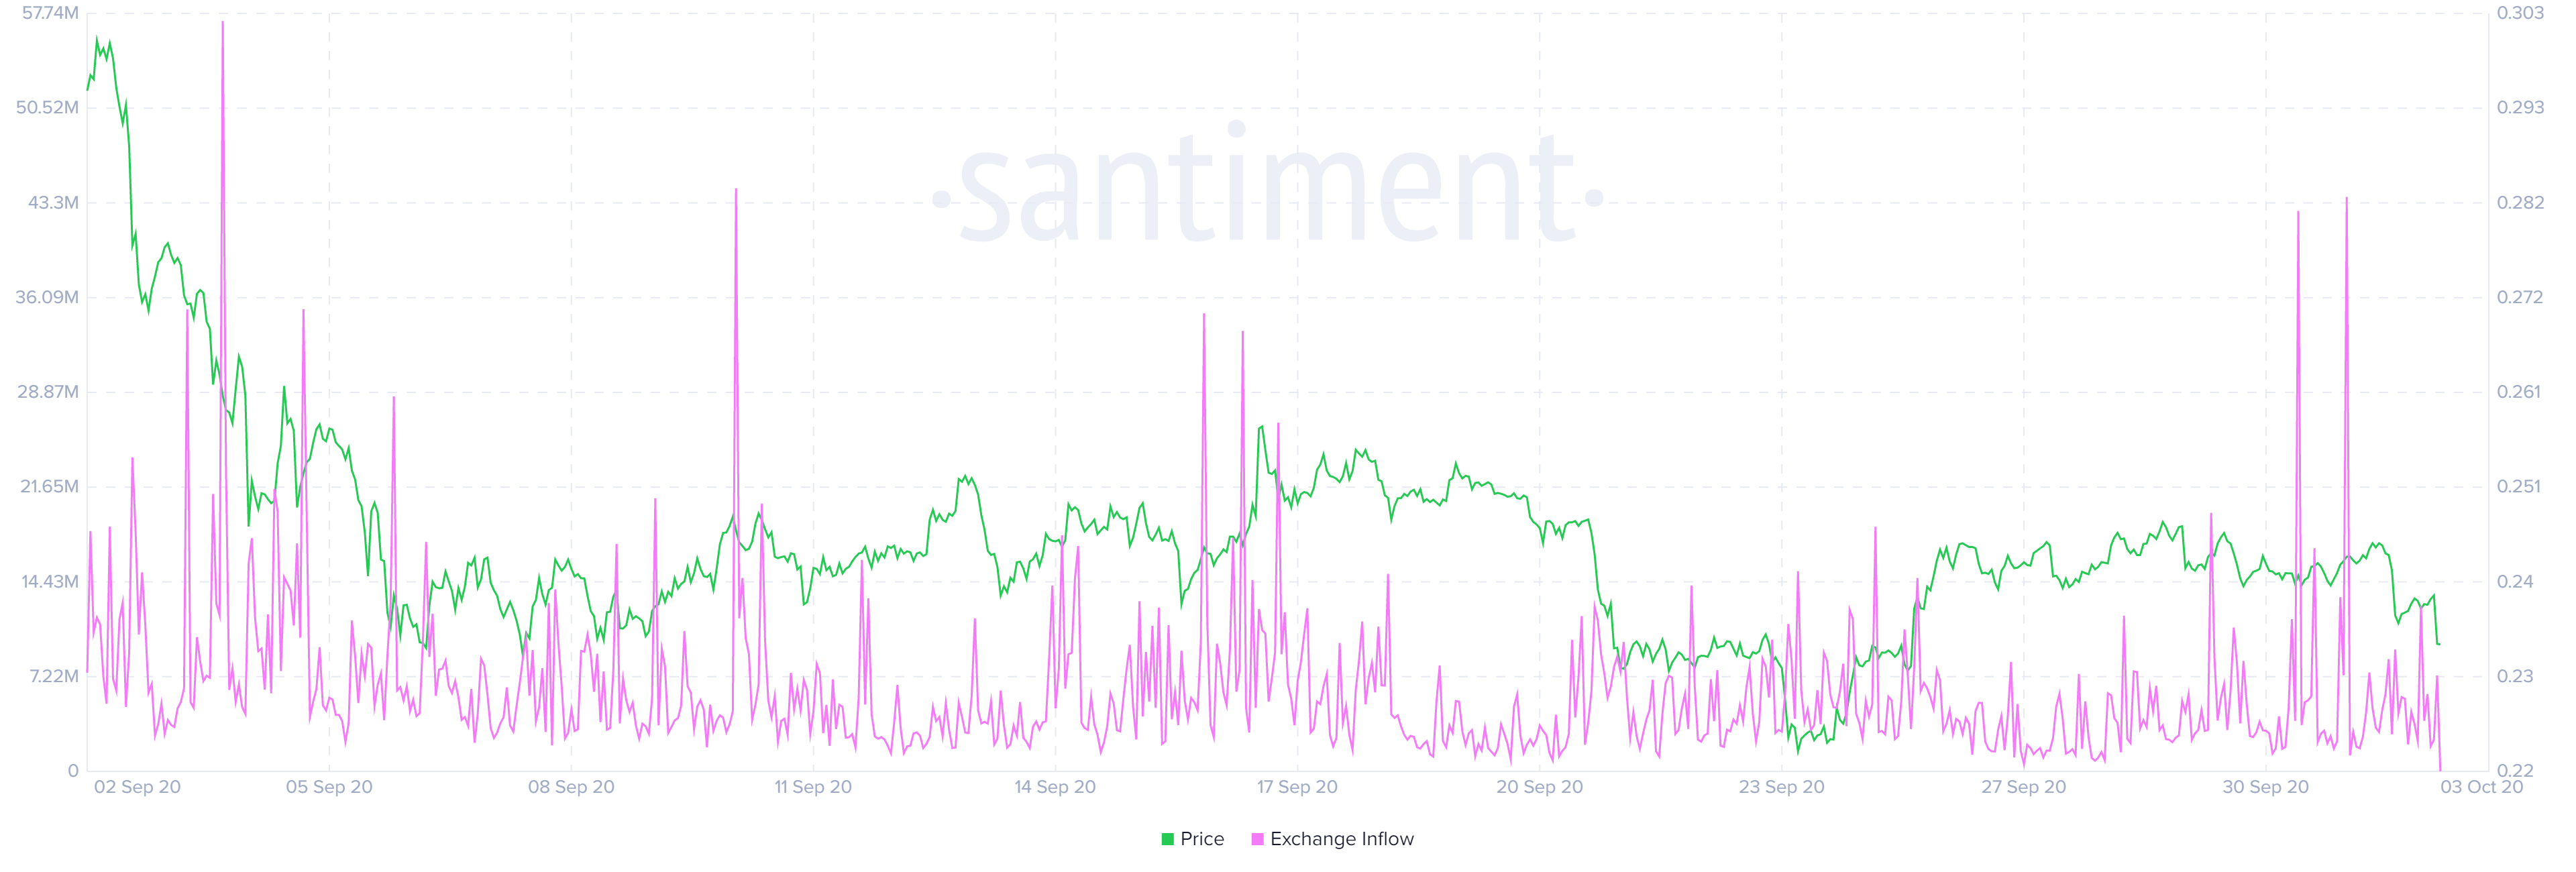
The retracement in the price has also been reflected in the exchange inflow as per the data by Santiment. Earlier this week, the exchange inflow of XRP surged to 44 million. The value of XRP increased from the support at $0.22 to highs close to $0.25. However, the decrease in the influx of XRP is occurring in tandem with the described breakdown. Unless a reversal in the inflow comes into the picture, XRP might continue to explore the rabbit hole.
Ripple exchange inflow chart
Daily takeaway
Bitcoin is likely to revisit Thursday's support at $10,400. If selling pressure increases, the flagship crypto could dive to $10,000. The primary support is much closer to $9,000 according to the IOMAP model; therefore, BTC is not done with the downside.
Ethereum could redeem itself if the regular users continue flocking back to take advantage of the low transaction fees. The increase in large non-exchange holdings could also help reduce the selling pressure.
Ripple, on the other hand, could explore the support at $0.22 if the selling pressure increases. However, take note of the support at $0.23, which might be strong enough to force a short term reversal.
Author

John Isige
FXStreet
John Isige is a seasoned cryptocurrency journalist and markets analyst committed to delivering high-quality, actionable insights tailored to traders, investors, and crypto enthusiasts. He enjoys deep dives into emerging Web3 tren


