Bitcoin, Ethereum and XRP plummet after CFTC accused BitMEX of evading U.S. regulations
- BitMEX was just charged with violating the Bank Secrecy Act and conspiracy to violate the same act.
- Samuel Reed, the co-founder of BitMEX, was arrested this morning.
- The entire cryptocurrency market plummeted after the news.

The total crypto market capitalization has lost around $13 billion in the past two hours after BitMEX news were released. Bitcoin is down 2.5% and is trading at $10,516. Similarly, Ethereum lost around 3% of its value while bears continue eying up further gains. XRP is also down 2.6%, losing a few crucial support levels.
Bitcoin could be the most affected digital asset
It’s important to note that BitMEX holds a significant portion of all Bitcoins in circulation. The BitMEX vault holds around 193,000 BTC, which is worth around $2 billion at current prices. It is unclear what will happen to the Bitcoin inside, but it’s having a significant impact on the price of the flagship cryptocurrency.
BTC/USD 15-minute chart
-637371755489535364.png)
On the 15-minute chart, the price has established a temporary bottom at $10,520, but according to our latest analysis, there isn’t a lot of support until $10,000 as most traders are shifting towards a bearish outlook. The shorts vs. longs chart is also flipping in favor of sellers.
Can XRP hold a crucial support level?
XRP has been one of the weakest cryptocurrencies throughout 2020 and a significant portion of 2019. The digital asset is still down 93% since its all-time high at $3.3.
XRP/USD daily chart
-637371755891299862.png)
XRP is currently trading at $0.236 after losing the 100-SMA on the daily chart. The 100-SMA was acting as a strong support level but was lost due to BitMEX accusations. The last low on the daily chart was established at $0.222. This level is a critical support level that, if broken, would take XRP down to the 50-SMA at $0.215.
XRP Holders Distribution
 [20.38.36, 01 Oct, 2020]-637371756045375538.png)
Looking at the Holders Distribution chart, we can observe that the downtrend that started on September 26 continues. The number of whales with at least 10,000,000 XRP coins has declined from 313 to 310, losing another holder today.
XRP/USD 4-hour chart
-637371756192575223.png)
The price has slipped below the 100-SMA and the 50-SMA on the 4-hour chart. If bulls cannot push it back up above at least the 50-SMA, XRP will most likely drop to $0.222 in the short-term. The MACD has also turned bearish on September 29 and shows more bearish strength now. The last time this indicator was negative, the price of XRP eventually saw a 13% correction.
Ethereum is holding better than the rest
Ethereum is one of the few cryptocurrencies that has enough influence in the market and many trading pairs to break its correlation with Bitcoin somewhat. For instance, back in July 2020, ETH was the first currency to see a breakout exploding from $250 to $311 within days, while Bitcoin remained trading below $10,000.
ETH/USD daily chart
-637371756419468038.png)
Nonetheless, Ethereum price is also down today but holding better than Bitcoin or XRP. The 100-SMA was not lost on the daily chart and will serve as a healthy support level. It seems that ETH price has formed a falling wedge on the daily chart with the 100-SMA as the first support level. If the SMA fails to hold, the lower trendline will be the next target for the bears.
ETH IOMAP Chart
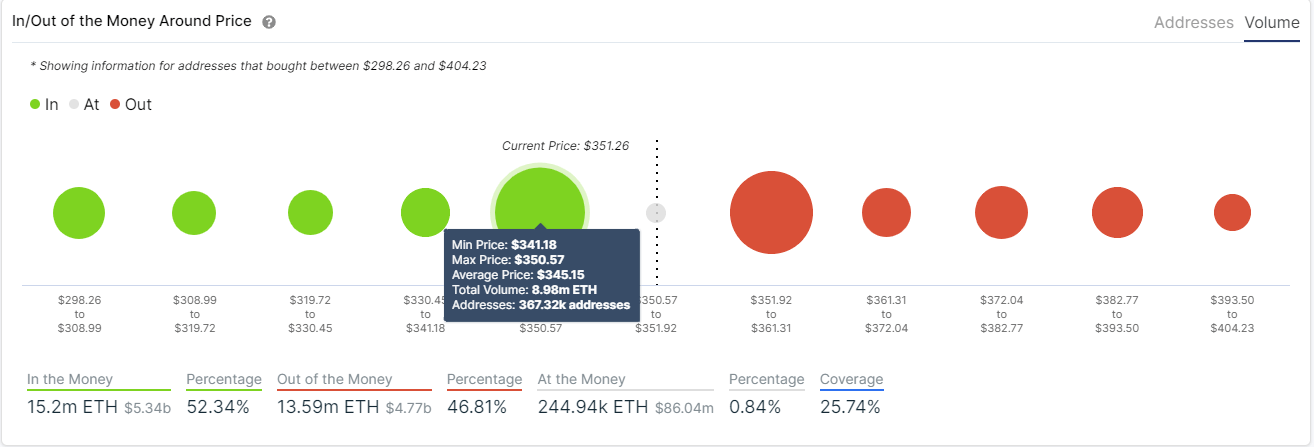
The IOMAP chart shows strong support between $341 and $350, where 9 million ETH was bought. However, below this range, the support is not great, which means $341 is a critical level to hold. A bearish breakout will most likely drop Ethereum down to $310.
On the other hand, a successful defense of the 100-SMA and a breakout of the falling wedge's upper trendline would be a strong bullish sign. This bullish pattern usually indicates that a reversal could be nearby after a downtrend. The target for bulls is the 50-SMA at $385.
Author

Lorenzo Stroe
Independent Analyst
Lorenzo is an experienced Technical Analyst and Content Writer who has been working in the cryptocurrency industry since 2012. He also has a passion for trading.


