Top 3 Prediction Bitcoin, Ethereum, Ripple: BTC perplexes, as ETH consolidates and XRP activates trading rule
- Bitcoin price needs a catalyst to shake the magnet effect of the 50-day simple moving average (SMA).
- Ethereum price meets resistance at long-term Fibonacci extension.
- XRP price breakout from bullish base falters, temporarily forcing traders to be defensive.

Bitcoin price breakout from an inverse head-and-shoulders pattern stalls, preserving the recent tendency to underperform lesser-known altcoins. Ethereum price meets the first significant technical challenge since $2,040. Ripple price remains aligned with new rally highs moving forward.
Bitcoin price searches for the magic formula
On April 30, Bitcoin price emerged from an inverse head-and-shoulders pattern with a strong 8% gain, but the price action following has been uncommitted, frustrating the biggest bulls, retail or institutional. Part of the reason has been the stubborn attraction to the 50-day SMA. Specifically, BTC has touched the intermediate-term moving average seven of the last eight trading days, with Bitcoin price never getting more than 5% above. Moreover, it is essential to note that the tactical moving average is trending downwards, adding to the downside pressure on price.
Since the magical rally of 10% on April 26, Bitcoin price has generated a meager 9% gain, leaving it way behind the leading digital assets that in some cases have delivered triple-digit returns from the April low.
A renewal of the rally from the April low will discover formidable resistance at the 361.8% Fibonacci extension of the 2017-2018 bear market at $63,777, a level that arrested the attempt at new highs in mid-April. Just above is another critical level of resistance, framed by the April high of $64,899 and the wedge’s lower trend line at $65,635.
If Bitcoin price can shake free from the resistance mentioned earlier, it will increase the probability for a test of the wedge’s upper trend line at $72,220. Beyond the trend line, BTC bulls are free to project a test of the 461.8% extension of the 2017-2018 bear market at $80,540
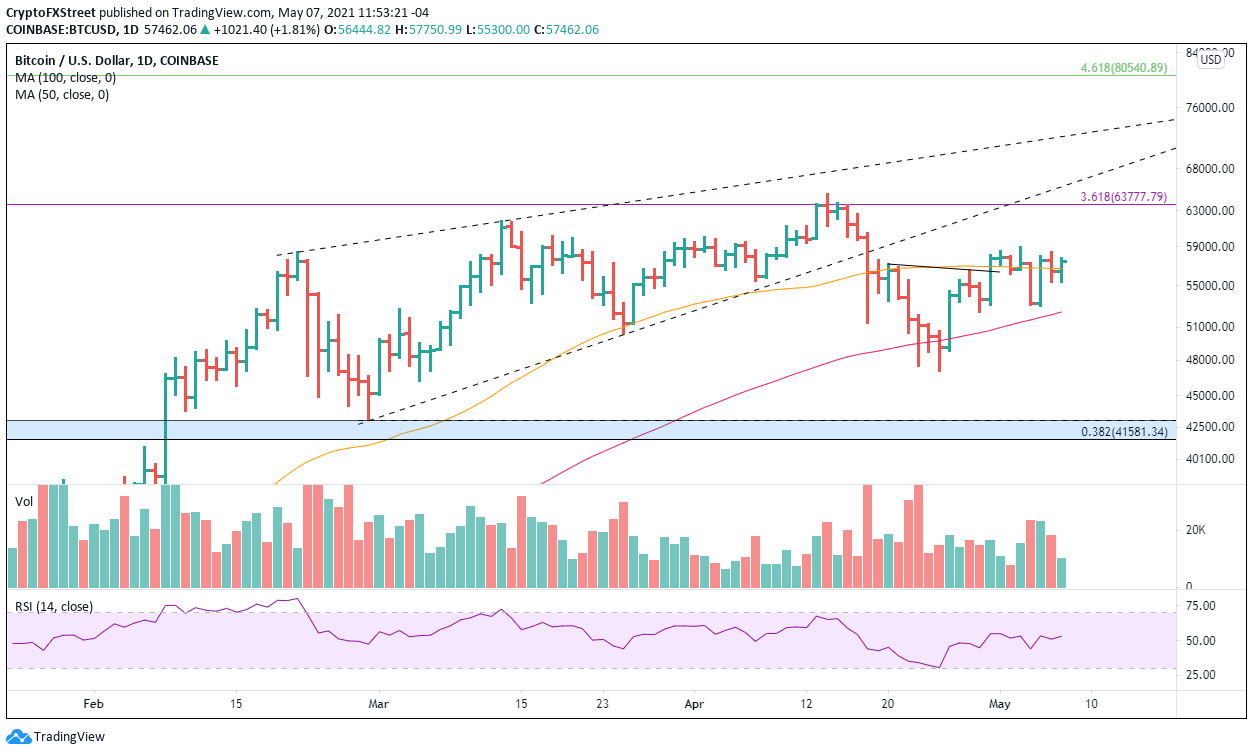
BTC/USD daily chart
Tuesday’s pullback came very close to breaking the low of the right shoulder at $52,369, a scenario that would void the mildly bullish outlook and return the spotlight to the support levels. The low of the right shoulder harmonizes with the 100-day SMA at $52,422.
The next support is the April low at $47,044, and if the situation deteriorates, Bitcoin price may test the February low at $43,016.
Ethereum price creating a lot of traps
A 110% gain over six weeks is a remarkable return for the leading digital asset. As a result, it touched the 261.8% Fibonacci extension of the 2018 bear market at $3,587 this week, accompanied by a minor bearish momentum divergence as the daily Relative Strength Index (RSI) failed to print new highs.
An earlier FXStreet article raised that Ethereum price was defining a rising wedge pattern on the 4-hour chart, lifting the probability that the then unfolding breakout from the wedge was a bull trap. Indeed, the breakout reversed and quickly tested the wedge’s lower trend line at $3,421. The reversal has since rebounded, but the mildly bearish outlook has not shifted.
Essential support begins at today’s low at $3,356, followed by the wedge’s first trough on May 4 at $3,416. More significant declines should settle around the 50 four-hour SMA at $3,153.
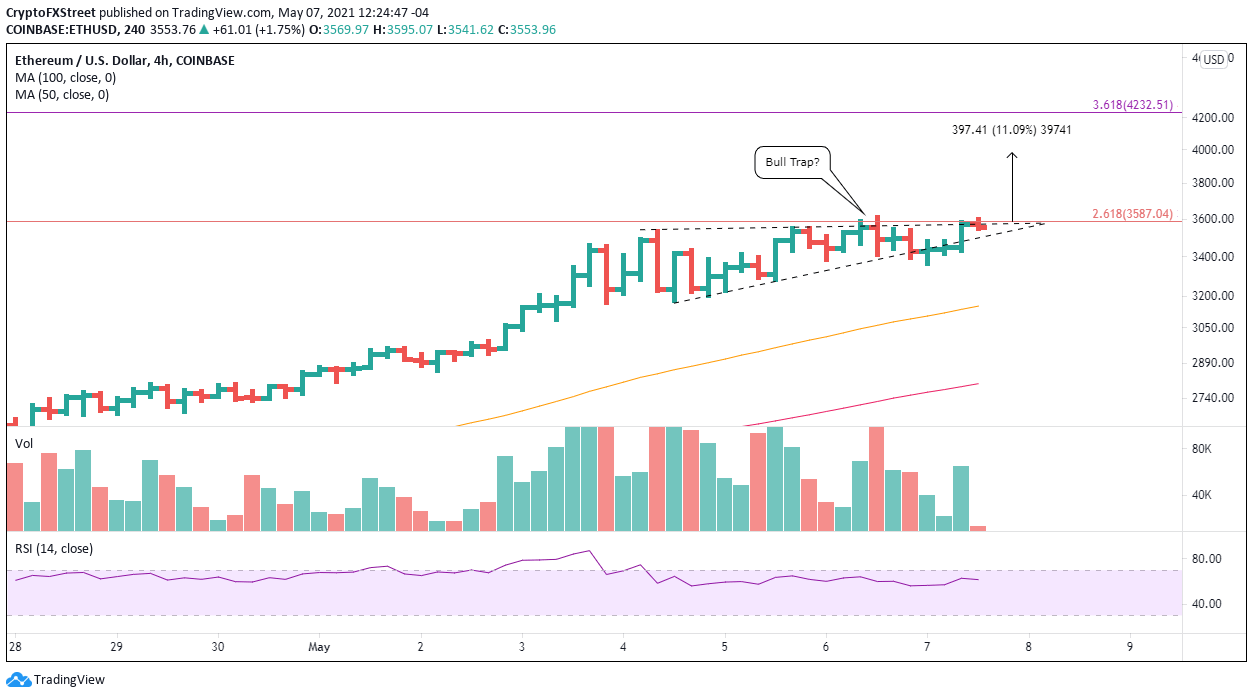
ETH/USD 4-hour chart
At the beginning of 2021, Ethereum price registered 6-week gains of around 135%. A solid daily close above the wedge will signal that ETH is ready to march higher this week, possibly to a gain of 135% over the last six weeks. The target price is $3,979.
Bigger aspirations for ETH could target the 361.8% Fibonacci of the April correction at $4,232. A gain close to 20% from the price at the time of writing.
XRP price throws a curveball to the bulls
Yesterday, XRP price emerged from a bullish cup-with-handle base, offering new traders the opportunity to capitalize on a time entry price. Unfortunately for the bulls, the breakout reversed back into the handle, triggering a trading rule: the pullback-plus-four. Specifically, if a breakout reverses back into the base, you give it four days to trade above the breakout high. A failure to do so increases the probability that XRP price is ready to decline or embarking on a more complex pattern.
For now, the bullish outlook is active, with the first resistance being the confluence of the April high at $1.96, the psychologically important $2.00 and the 61.8% Fibonacci retracement of the 2018-2020 bear market at $2.08.
The measured move target of the cup-with-handle base is $3.16, yielding a gain of 90% from the handle high at $1.66. A rally of this magnitude would put XRP price within reach of the 2018 all-time high of $3.30.
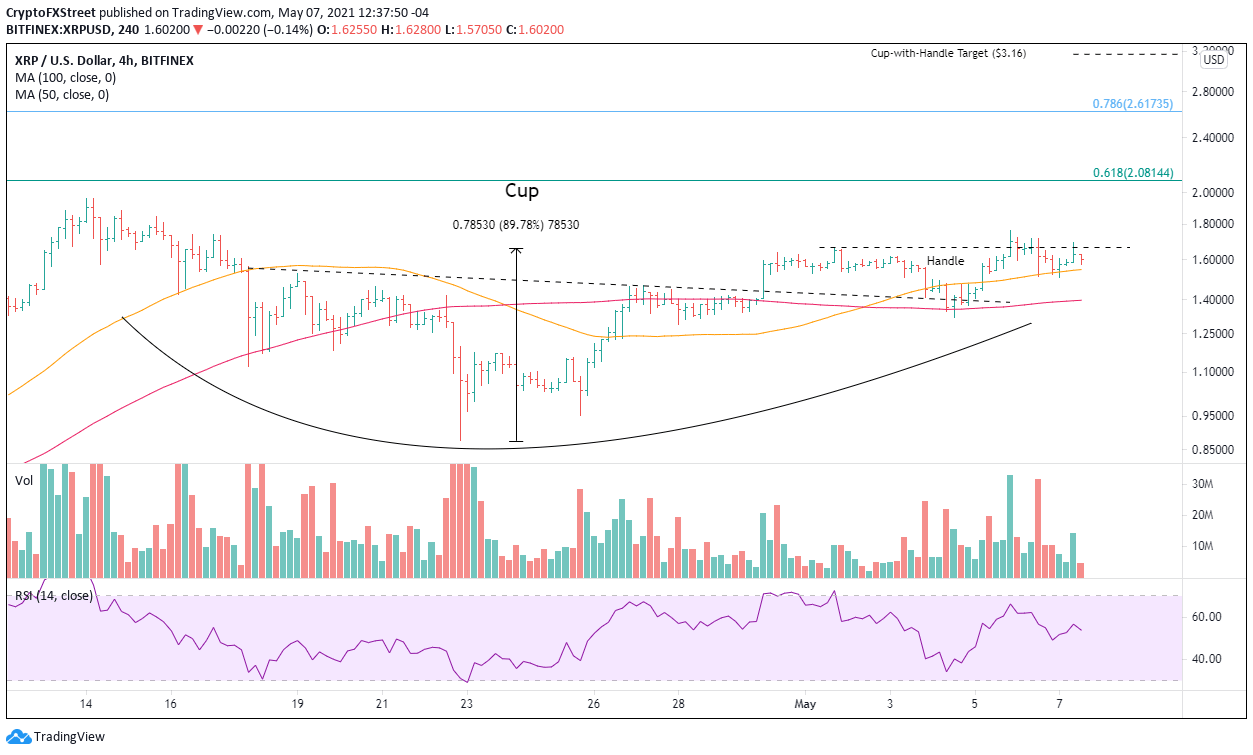
XRP/USD 4-hour chart
A failure to trade above the breakout high of $1.76 within four days should put traders on the defensive and prompt at least a reduction in positions. A decline below the handle low of $1.31 would indicate that XRP price is vulnerable to a monster pullback or a more complex bottoming process.
Author

Sheldon McIntyre, CMT
Independent Analyst
Sheldon has 24 years of investment experience holding various positions in companies based in the United States and Chile. His core competencies include BRIC and G-10 equity markets, swing and position trading and technical analysis.


