Top 3 Price Prediction Bitcoin, Ethereum, Ripple: JP Morgan CEO still not sold on cryptocurrencies, market scrambles to find support
- Bitcoin price seems to be holding well despite Tuesday’s sudden crash.
- Ethereum price has kick-started its consolidation after setting up an all-time high at $3,530.
- Ripple price dipped below the demand zone’s lower boundary at $1.33 but showed signs of recovery.

Bitcoin price shows no bearish signs yet despite its rapid sell-off on Tuesday, but its move hereon will determine its direction. Ethereum, on the other hand, has an entirely different outlook and shows a rigorous tussle between the buyers and sellers, leading to sideways movement.
Unlike BTC or ETH, XRP price shows a bullish bias as it tagged a critical demand barrier.
Jamie Dimon reveals his thoughts on cryptocurrencies
While the cryptocurrency market takes a breather after the recent sell-off, Jamie Dimon, the CEO of JP Morgan, stated earlier today he is not a “Bitcoin supporter” and has no “interest” in it.
However, Dimon adds,
Blockchain is real. We use it. But people have to remember that a currency is supported by the taxing authority of a country, the rule of law, a central bank… On the other hand, clients are interested, and I don’t tell clients what to do.
Such a move by Dimon isn’t the first. In fact, the CEO called Bitcoin a “fraud” during a CNBC conference in September 2017.
Bitcoin price grows increasingly indecisive
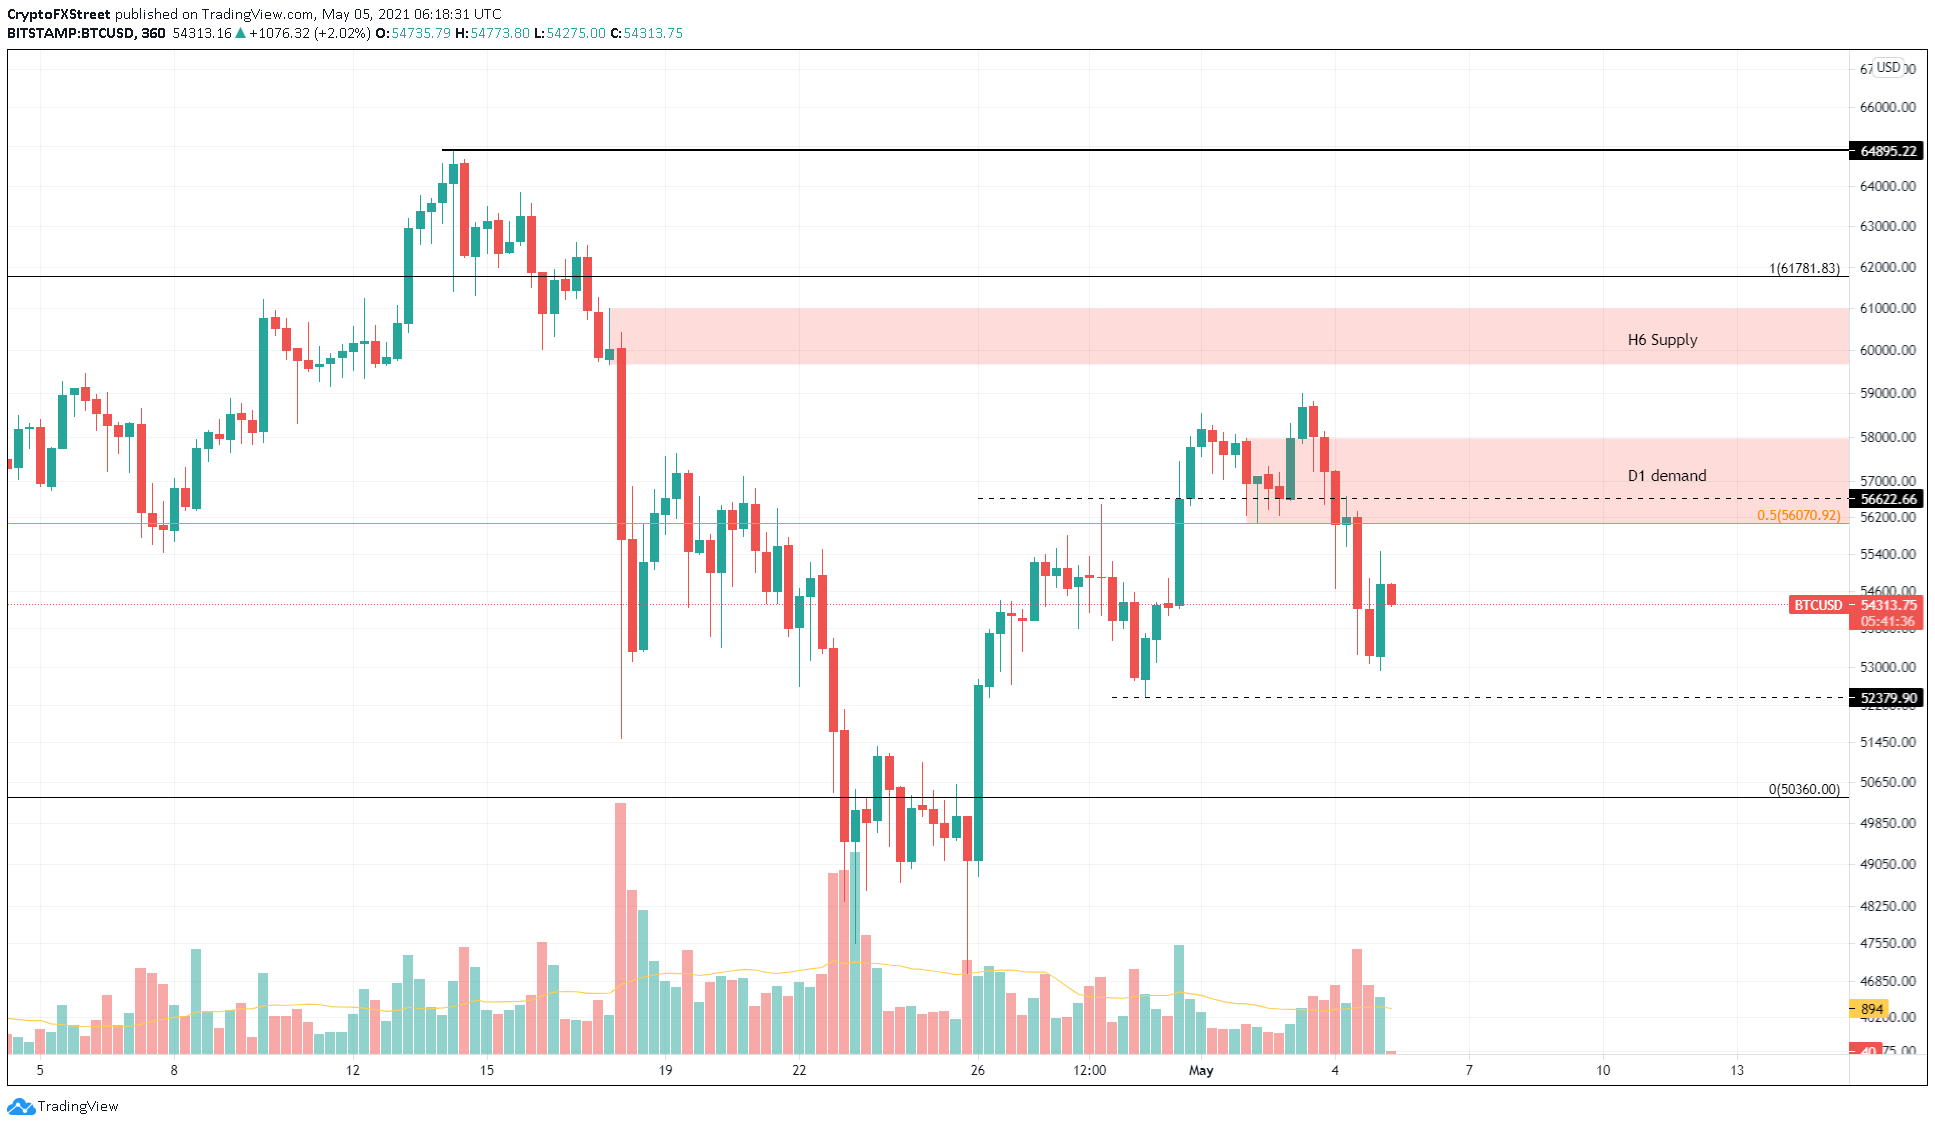
On the 6-hour chart, Bitcoin price shows the formation of higher highs and higher lows since April 26. Tuesday’s sell-off depreciated BTC’s market value by roughly 8% but failed to break its bullish market structure.
An upswing in Bitcoin price will face the immediate supply barrier that extends from $56,064 to $57,967. Within this zone is the previous weekly candlestick’s opening price at $56,222. Suffice to say, BTC’s journey is an uphill battle.
However, a swift break through this resistance level leading to a decisive close above $57,967 will open up Bitcoin price for a 5% rally to the next area of supply that ranges up to $61,000.
A 6-hour candlestick close above this barrier with a substantial volume spike will open Bitcoin price for a chance to retest its all-time highs.
BTC/USD 6-hour chart
On the flip side, a rejection at $56,064 will result in a range-bound move for Bitcoin price for the foreseeable future. However, a breakdown of the support level at $52,379 will invalidate this bullish outlook and kick-start a 5% downtrend to $50,360.
Ethereum price in lockstep as it begins to coil up
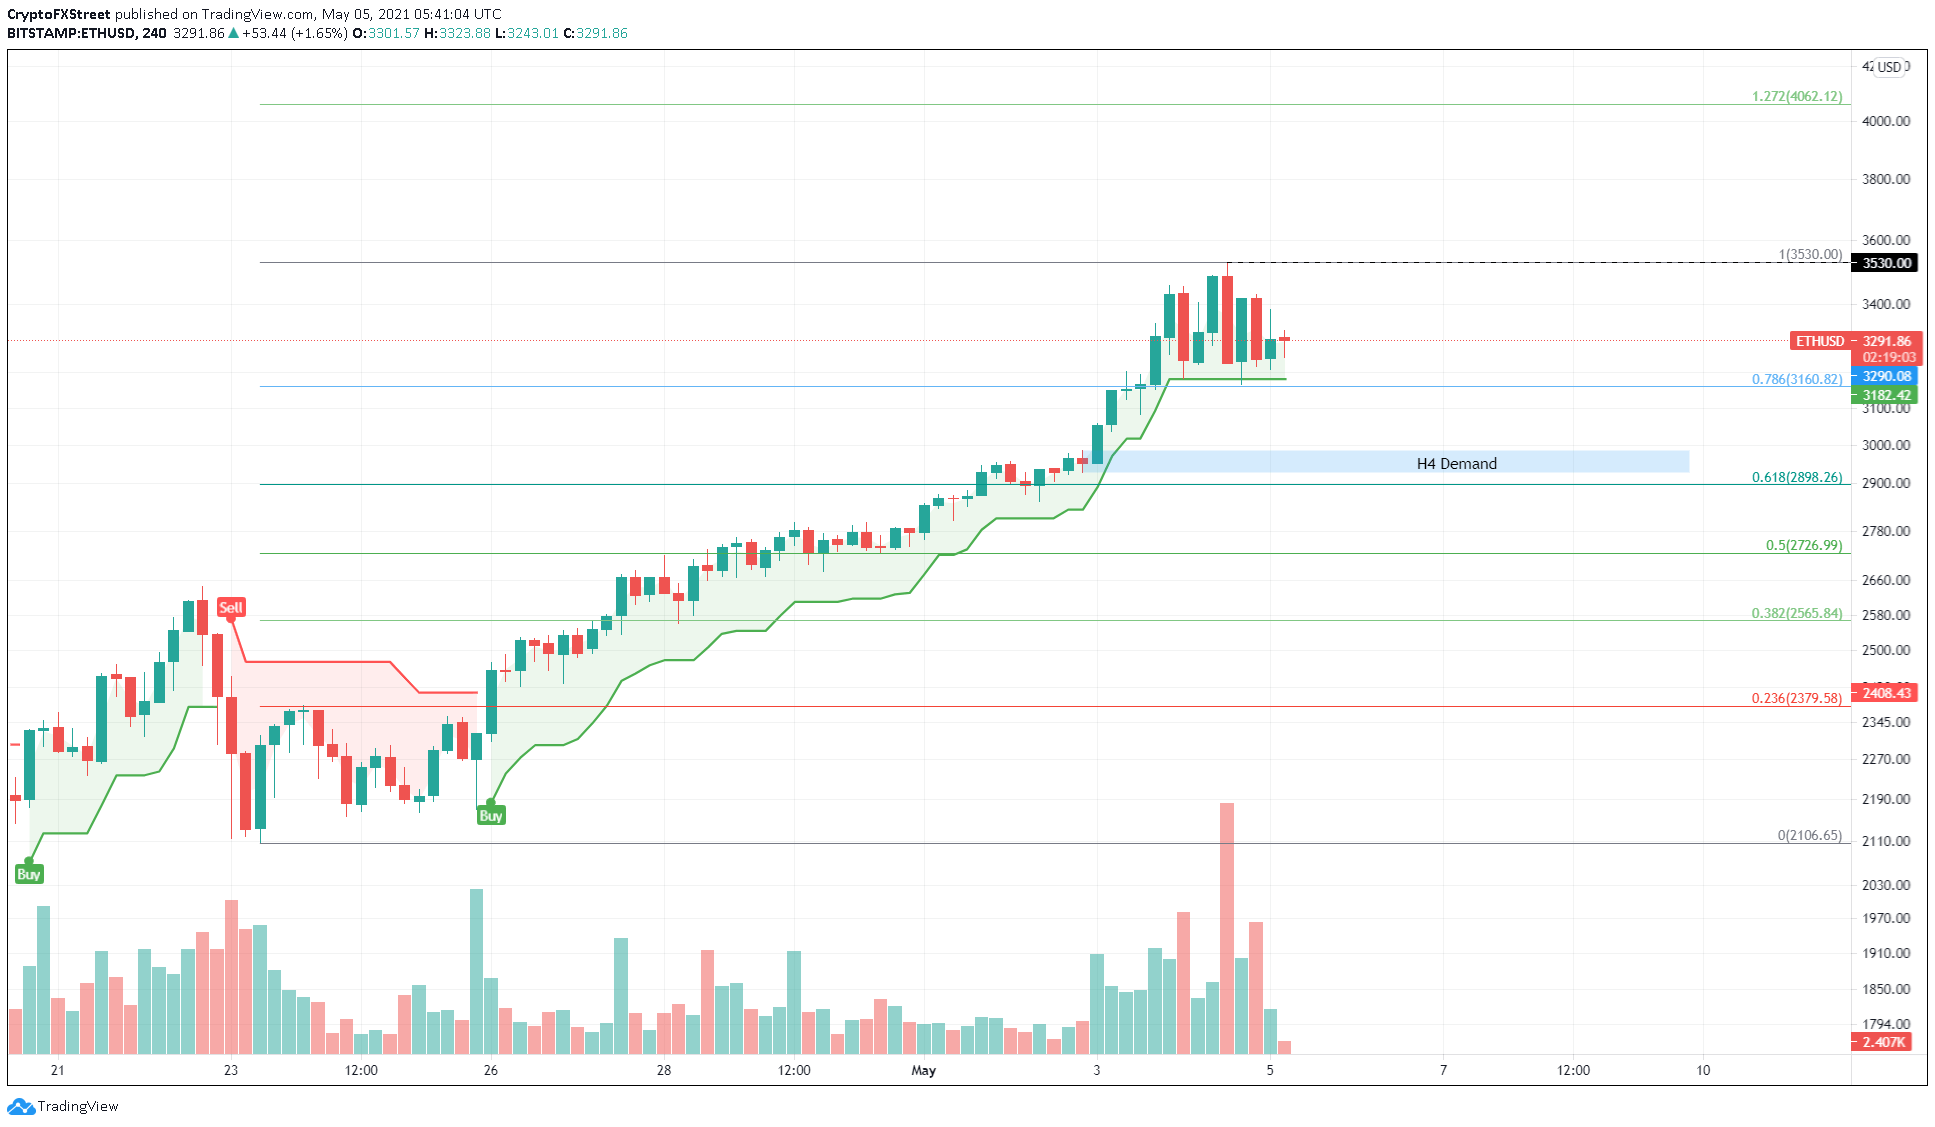
Ethereum price shows a series of tightly woven 4-hour candlesticks of nearly the same height. Such a setup reveals that the buyers and sellers are trying to take control of ETH but are canceling each other’s momentum.
A breakdown of the 78.6% Fibonacci retracement level at $3,160 will trigger the SuperTrend indicator to produce a sell signal. This move would indicate a shift in momentum toward the bears.
In such a case, investors can expect Ethereum price to set up a new swing low around the demand zone that stretches from $2,986 to $2,928.
The 61.8% Fibonacci retracement level at $2,898 will be the next area of support if the bears overwhelm the bullish momentum.
ETH/USD 4-hour chart
However, a potential spike in buying pressure that produces a decisive close above $3,530 might trigger a 15% rise to a new all-time high at $4,062, coinciding with the 127.2% Fibonacci extension level.
XRP price shows resilience
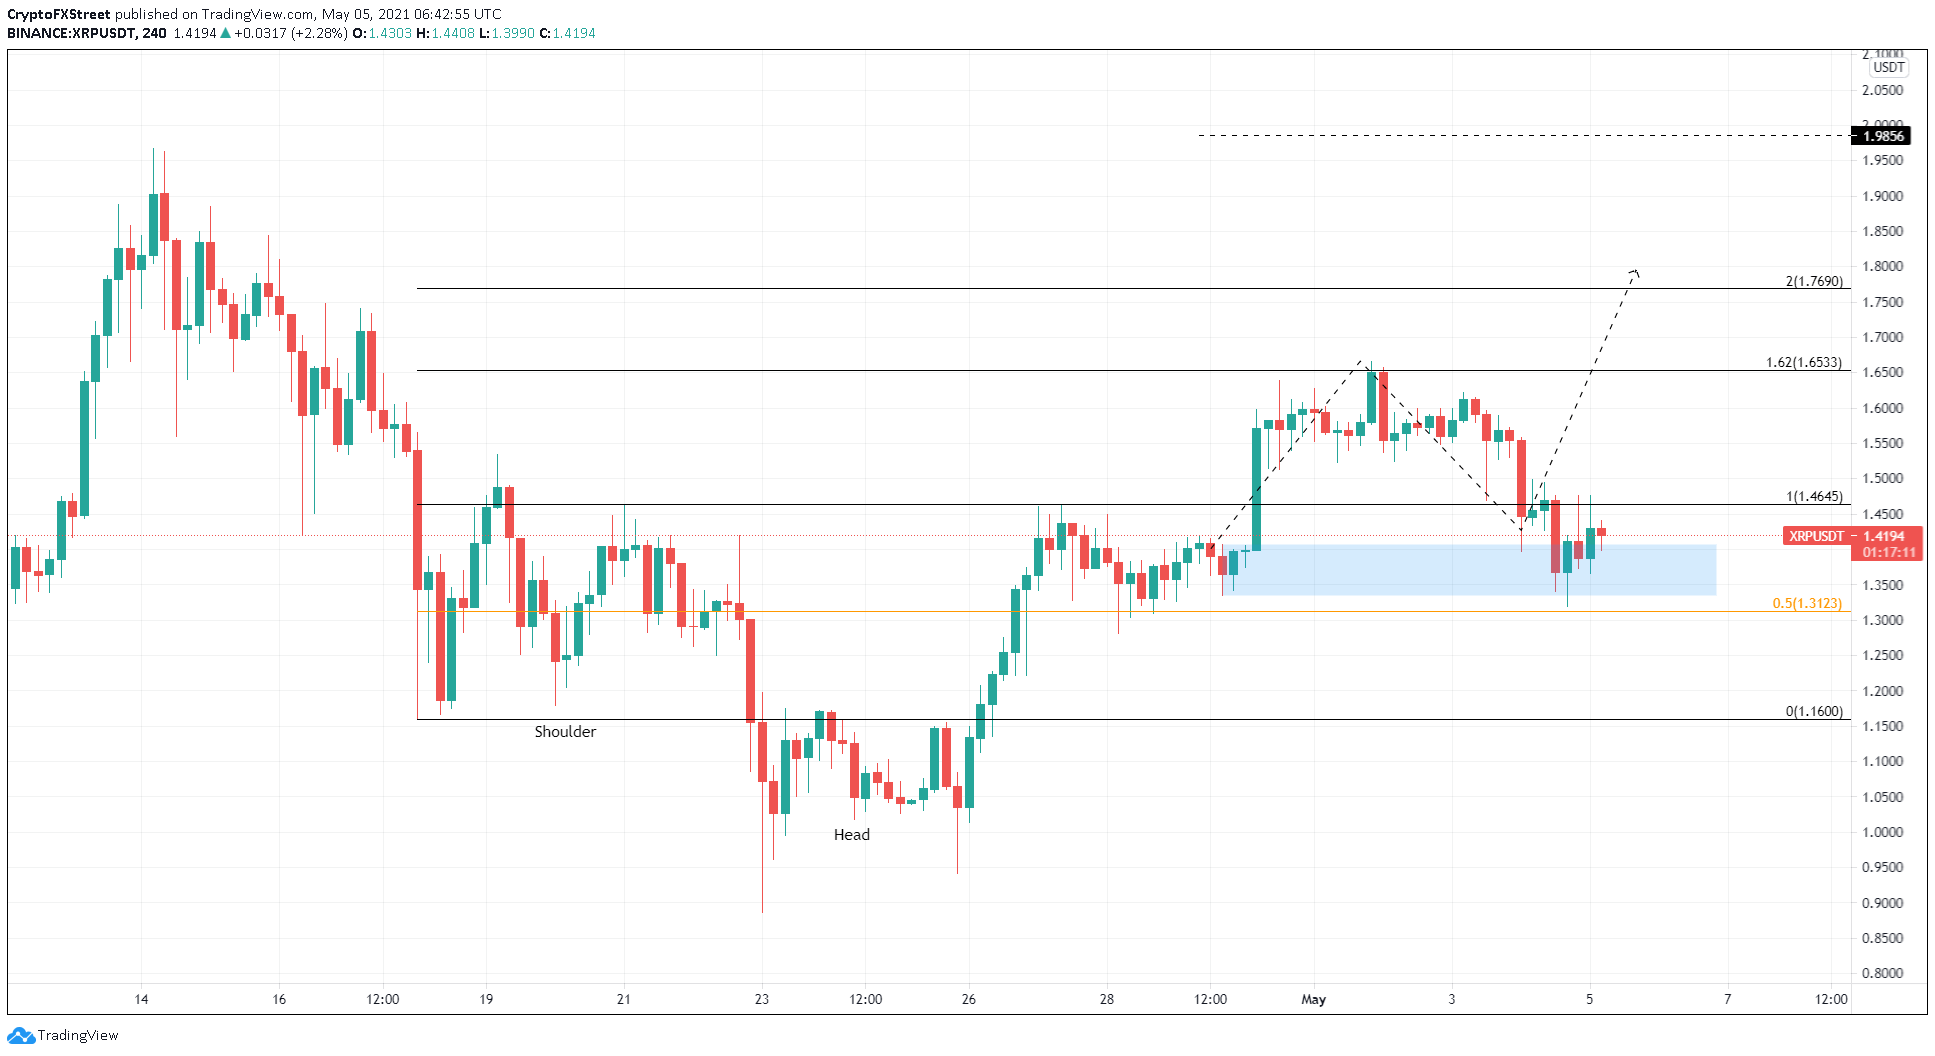
XRP price is sticking to its guns despite collapsing 15% on May 4. The remittance token has risen above the demand zone, ranging from $1.33 to $1.40 and fast approaching a critical resistance level at $1.42.
A 4-hour candlestick close above this barrier will confirm the bullish momentum and open the possibility of a 15% upswing to a recent swing high at $1.63.
XRP/USDT 4-hour chart
However, a breakdown of the said demand barrier will signal a slowdown in the buying pressure. If the 50% Fibonacci retracement level at $1.31 is breached, the remittance token will likely slide 11% to tag $1.16.
Author

Akash Girimath
FXStreet
Akash Girimath is a Mechanical Engineer interested in the chaos of the financial markets. Trying to make sense of this convoluted yet fascinating space, he switched his engineering job to become a crypto reporter and analyst.



