Top 3 Price Prediction Bitcoin, Ethereum, Ripple: BTC struggles, while ETH dominates and XRP pursues $2
- Bitcoin price learning it is not vital to the success of the cryptocurrency complex.
- Ethereum price embraces FOMO with a 110% gain over the last six weeks.
- XRP price presents a high probability entry price for traders.

Bitcoin price having trouble shaking the magnet effect of a critical intermediate-term moving average, despite broader strength in the cryptocurrency market. Conversely, Ethereum price has overcome an overbought condition on Monday to mark new all-time highs today, and XRP price releases from a bullish pattern.
Bitcoin price remains uncommitted, frustrating speculators
On April 30, Bitcoin price broke out from an inverse head-and-shoulders bottom with an 8% gain, but the price action since has been reluctant and frustrating. Part of the reason has been the 50-day simple moving average’s (SMA) stubborn role in curtailing follow-through gains. Accurately, BTC has touched the moving average every day since April 30, with Bitcoin price never getting more than 5% above.
Since the April 26 rally of 10%, Bitcoin price has achieved a paltry 9% gain, leaving it far below the performance of most of the other cryptocurrencies. Tuesday’s pullback came close to breaking below the right shoulder at $52,369 of the inverse head-and-shoulders pattern.
A resumption of the rally from the April low will find challenging resistance at the 361.8% Fibonacci extension of the 2017-2018 bear market at $63,777, a level that stymied the rally in mid-April. Further resistance is expected at the intersection of the April high of $64,899, with the wedge’s lower trend line at $65,243.
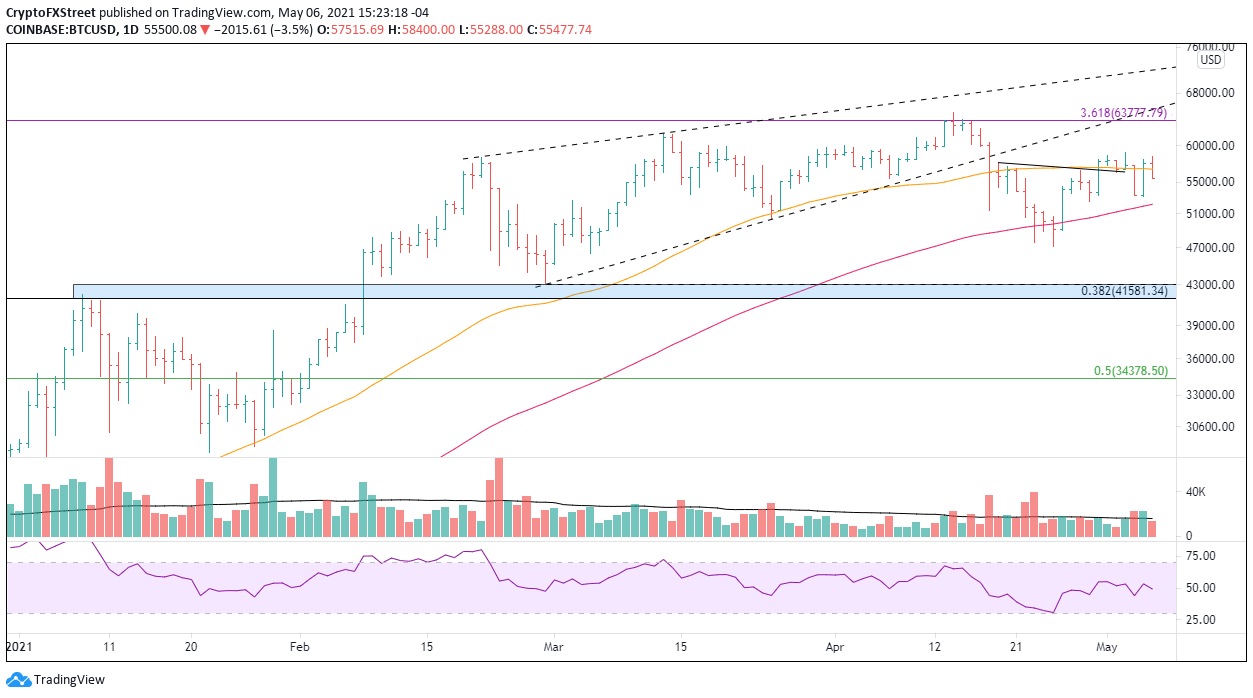
BTC/USD daily chart
If Bitcoin price falls below the right shoulder at $52,369, it would negate the mildly bullish outlook and turn attention to the support levels. The first support is the 100-day SMA at $52,157 and then the April low at $47,044. Any further weakness leaves Bitcoin price exposed to test the February low at $43,016.
Ethereum price advance reveals a troubling pattern
The ETH 6-week rate-of-change (ROC) has eclipsed 110%, and Ethereum price has tagged the 261.8% Fibonacci extension of the 2018 bear market at $3,587 with the daily Relative Strength Index (RSI) now showing a bearish momentum divergence with the price high.
Ethereum price could rally further, hitting a 6-week gain of 130%, which happened in early 2021. However, ETH has constructed a rising wedge pattern on the four-hour chart, raising the odds that the unfolding breakout from the wedge today is a bull trap.
If a reversal begins today, the initial support is the wedge’s lower trend line at $3,386. Additional support levels can be considered if the trend line is overcome with selling.
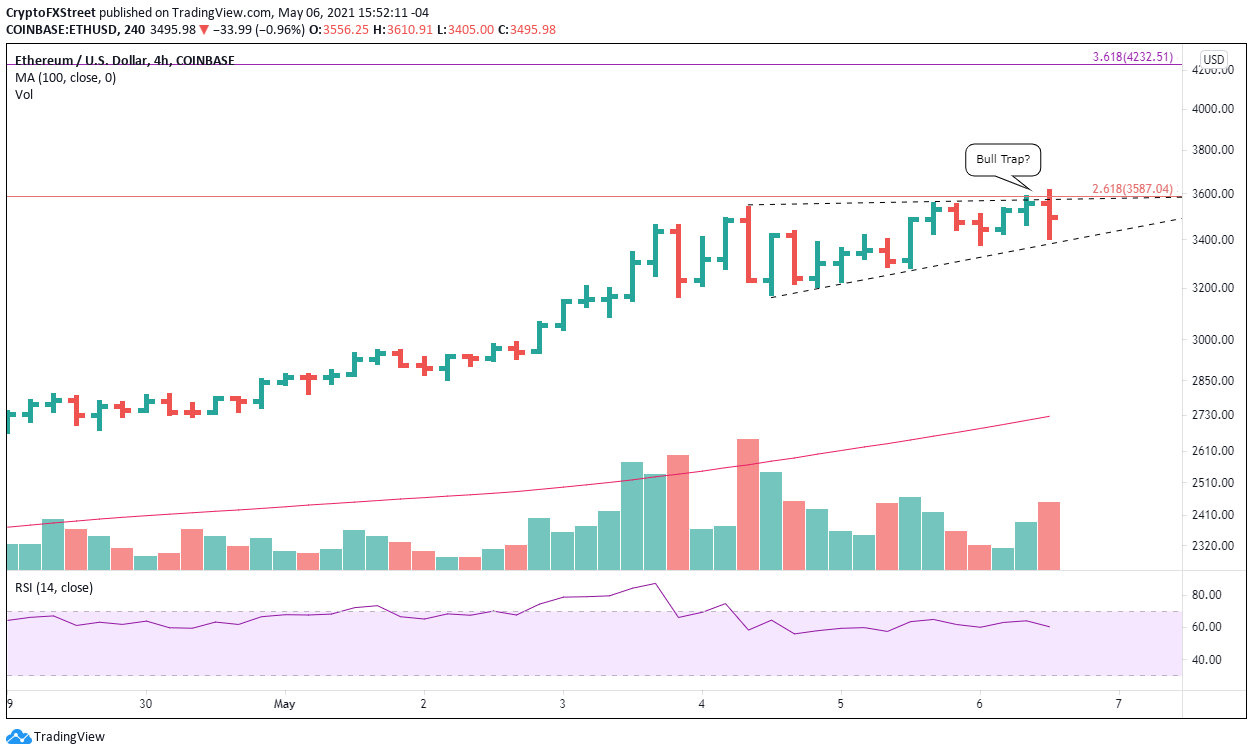
ETH/USD 4-hour chart
A strong close above the wedge on the daily chart will allow speculators to target much higher prices, potentially the 361.8% extension of the April correction at $4,232, a gain of almost 20% from the price at the time of writing.
XRP price presents a new opportunity for traders arriving late
XRP price has triggered a bullish cup-with-handle base today, offering new traders the chance to capitalize on a timely entry price. XRP price will encounter resistance at the April 13 high at $1.96, but the more significant challenges will be $2.00 and $2.08, the 61.8% Fibonacci retracement of the 2018-2020 bear market.
The measured move target of the cup-with-handle base is $3.16, yielding a gain of 90% from the handle high at $1.66. A rally of this magnitude would put XRP price within reach of the 2018 all-time high at $3.30.
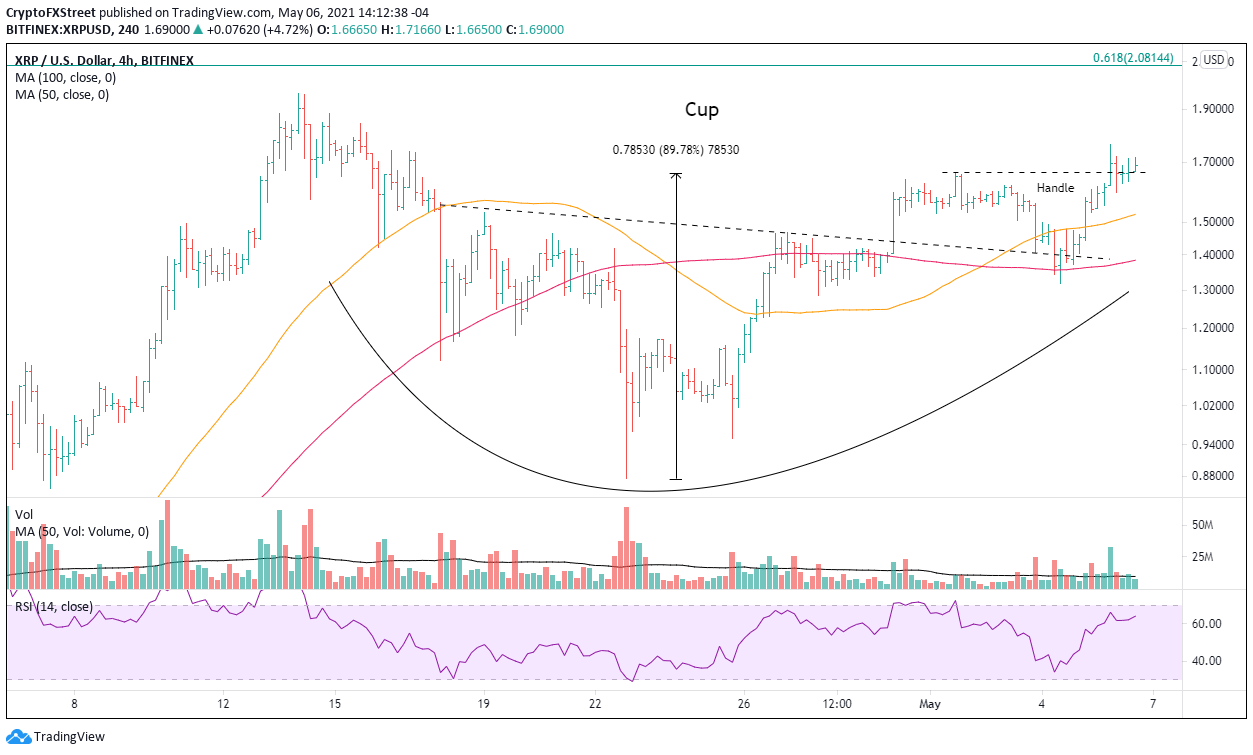
XRP/USD 4-hour chart
A decline below the handle low of $1.31 would be a warning that XRP price was vulnerable to a more significant pullback and, as a result, a more complex bottoming process.
Author

Sheldon McIntyre, CMT
Independent Analyst
Sheldon has 24 years of investment experience holding various positions in companies based in the United States and Chile. His core competencies include BRIC and G-10 equity markets, swing and position trading and technical analysis.


