Top 3 Price Prediction Bitcoin, Ethereum, Ripple: ETH waits for no one, while art market goes crypto
- Bitcoin price wavers at the 50-day simple moving average (SMA).
- Ethereum price 6-Week Rate of Change (ROC) indicator warns of extended conditions.
- Ripple price fumbles inverse head-and-shoulder bottom breakout with double-digit reversal.

Bitcoin price momentum fails to impress in the first test of meaningful resistance. Ethereum price displays unwavering speculator commitment and emotion. XRP price on pace for the worst daily decline since April 7.
Wave of cryptocurrency adoption spreads into new markets
In a first for the physical art market, Sotheby’s said today it would accept BTC and ETH as payment for Banksy’s iconic artwork “Love is in the Air,” marking a new height for mainstream acceptance of cryptocurrencies and a sign of an enterprise evolving to attract new collectors. The work is estimated to fetch between $3 million to $5 million.
With the growing adoption of digital art and NFTs, along with our increased focus on digital innovation, we’ve seen an increasing appetite among collectors for more seamless payment options when doing business with Sotheby’s.

Bansky's "Love is in the Air"
To facilitate the expansion into cryptocurrency payments, the auction house is collaborating with cryptocurrency exchange Coinbase Global Inc. for the sale. The new payment solution is expected to be a catalyst for further adoption of cryptocurrencies across Sotheby’s auctions. Stefan Pepe, Sotheby’s Chief Technology Officer, described the partnership as “a natural progression.”
Sophisticated investor demand for cryptocurrency benchmarks increases
S&P Dow Jones Indices (S&P DJI), the leading index provider, has officially launched its new digital asset benchmarks, the S&P Digital Market Indices. The new indices are constructed to measure the performance of digital assets listed on recognized cryptocurrency exchanges.
The index series includes the S&P Bitcoin Index, the S&P Ethereum Index and the S&P Cryptocurrency MegaCap Index, which measures the performance of Bitcoin and Ethereum digital assets.
The new series will make it easier for investors to access and assess the cryptocurrency market and provide a tool to reduce the inherent volatility in the highly speculative assets.
The Digital Market Indices will make it easier for investors to access and assess this emerging technology-driven asset class while potentially mitigating some of the common risks associated with this traditionally speculative market.
Greg Fleming from Rockefeller Capital Management today highlighted the need for reliable and transparent benchmarks backed by quality pricing data because cryptocurrencies are “probably something that is more secular in nature though - digital currencies are going to be part of the future.”
S&P Dow Jones Indices will be adding to the Digital Market Indice series later this year that will include additional coins and broader-based indices such as large-cap and broad market benchmarks.
Bitcoin price rebound not attracting a new wave of believers
On April 30, Bitcoin price broke the neckline of an inverse head-and-shoulders pattern and cleared the 50-day simple moving average (SMA). Since then, BTC has rested on the moving average, unable to garner further price traction. As a result, the bellwether cryptocurrency has declined below the moving average and neckline.
A trade below the right shoulder at $52,369 will void the BTC breakout and raise the odds that it will test the 100-day SMA at $51,663 and the April low at $47,044.
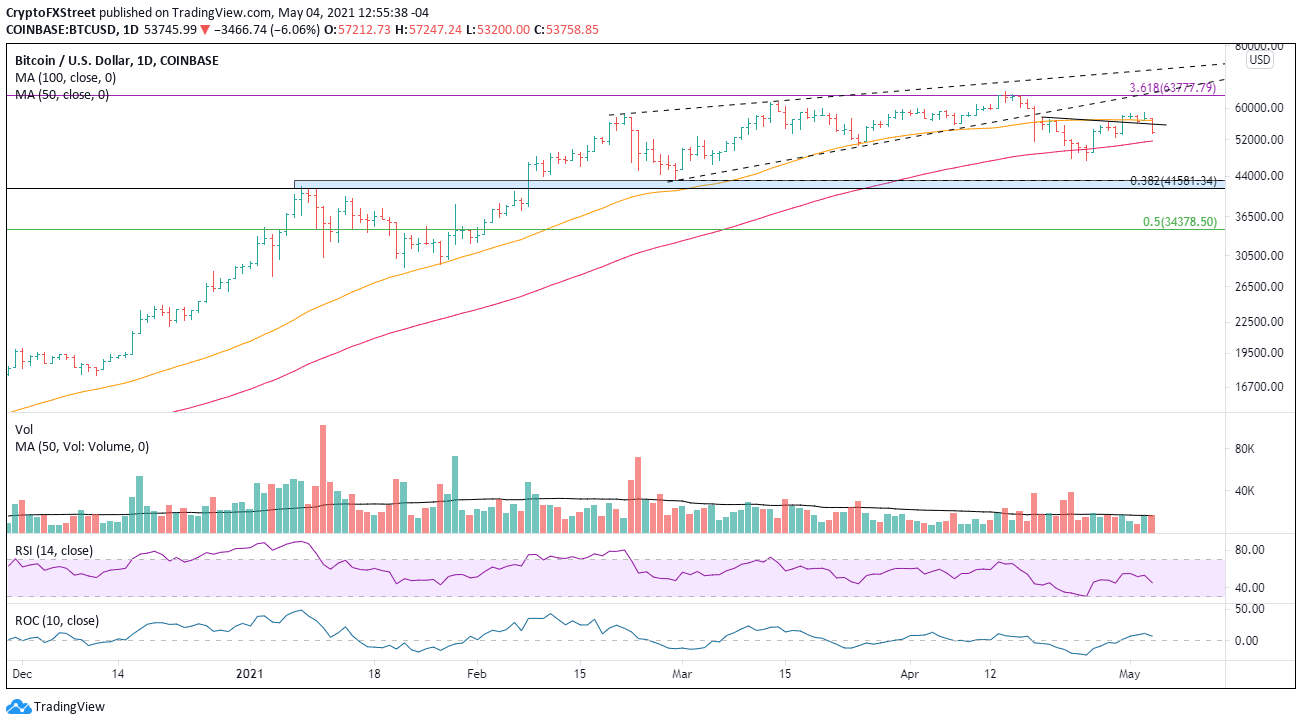
BTC/USD daily chart
Speculators need to be alert for a bear trap, where Bitcoin price slightly undercuts the right shoulder and forcefully rebounds. A resumption of the rally from the April low will find challenging resistance at the intersection of the 361.8% Fibonacci extension of the 2017-2018 bear market at $63,777 with the wedge’s lower trend line at $64,800.
Ethereum price enthusiasm is unmatched in the cryptocurrency complex
The ETH 6-week rate-of-change (ROC) is 96%, signaling a short-term top printed this week. The 96% gain is rare, surpassed only by the rally that kickstarted 2021 and rallies in 2017 and at the beginning of 2018.
Adding to the greater probability of a high this week is that Ethereum price neared the 261.8% Fibonacci extension of the 2018 bear market at $3,587 this morning.
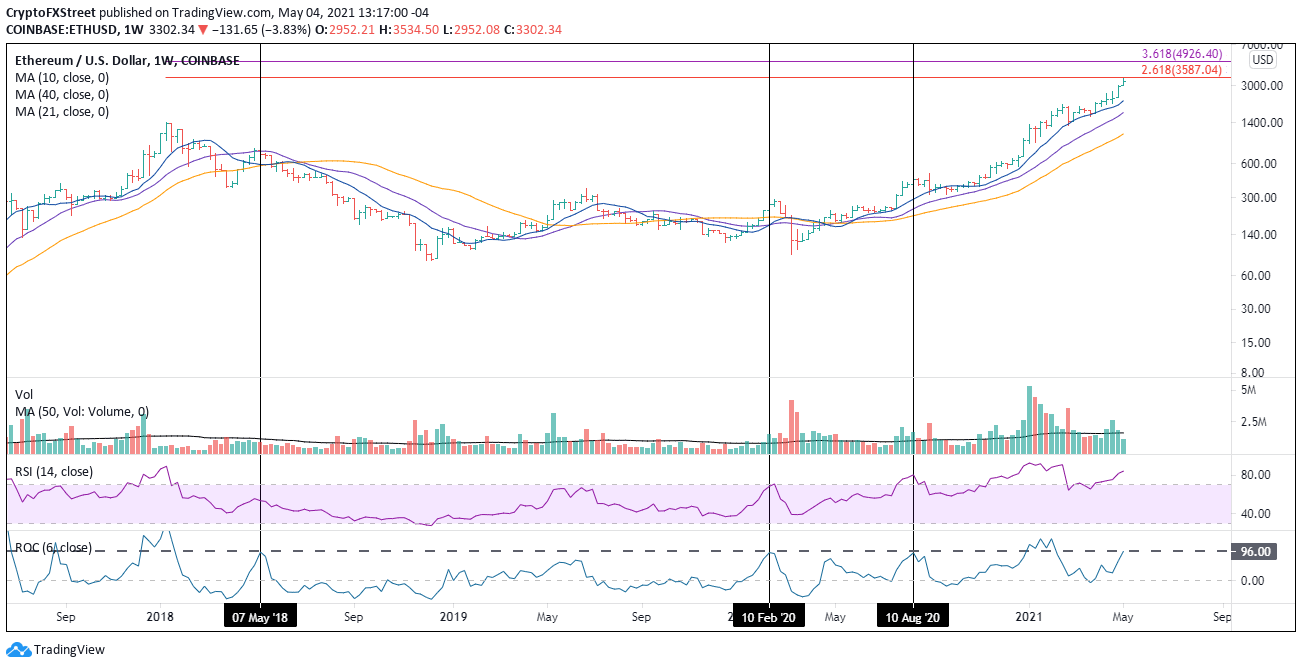
ETH/USD weekly chart
A pause for the Ethereum price advance will find heavy support at the 21-day SMA at $2,581.
XRP price can’t shake loose from the selling pressure
After rallying 180% in April, 50% for the week and 13% one day, it is no coincidence that speculators are taking profits this week, but the longer-term bullish outlook remains active.
Resistance is anticipated to unfold at the 78.6% Fibonacci retracement of the April decline at $1.73, about 10% above the current price. Ripple enthusiasts are fixated on the psychologically important $2.00 and the 61.8% retracement of the 2018-2020 bear market at $2.08. The XRP price oscillations around $1.00 in early April propose that $2.00 could be imposing.
The measured move target of the inverse head-and-shoulders pattern is $2.47, a gain of 70% from the neckline position on April 29 and nearly 60% from the current XRP price. Aggressive speculators should look to the 78.6% retracement of the 2018-2020 bear market at $1.62 as the ultimate resistance.
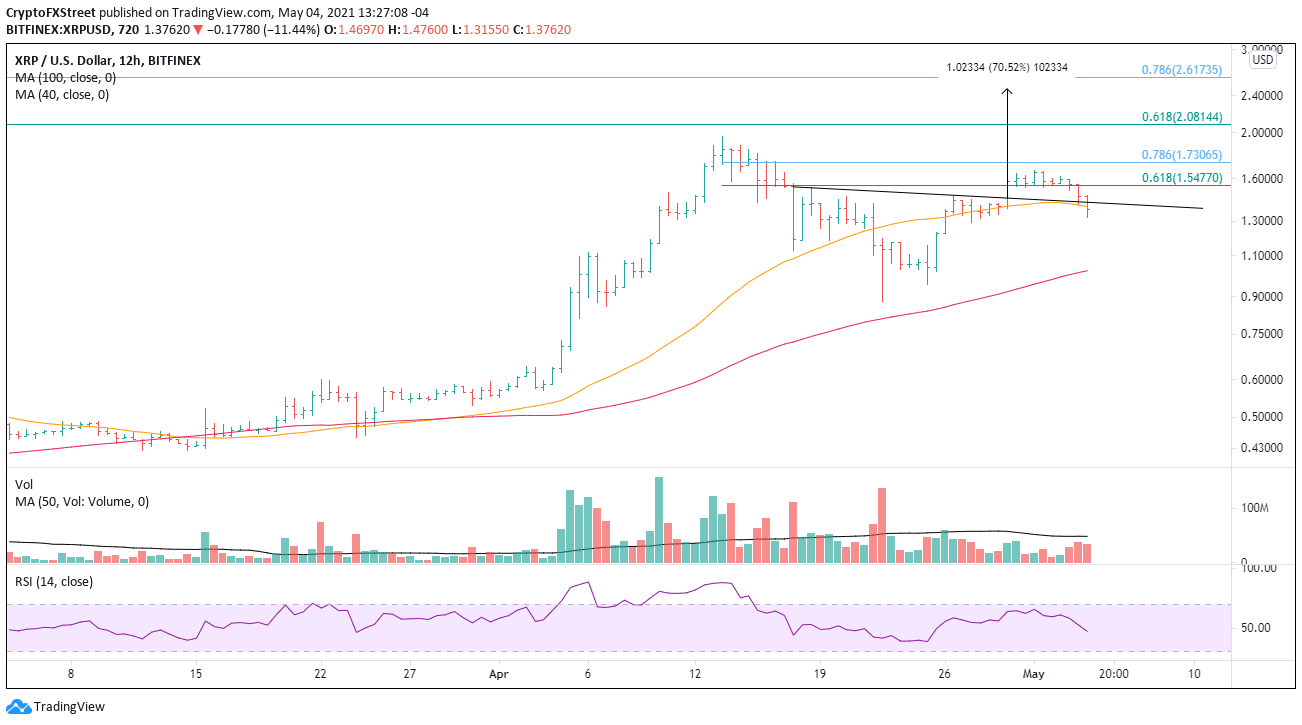
XRP/USD 12-hour chart
A decline below the right shoulder at $1.28 would invalidate the inverse head-and-shoulders bottom and expose XRP price to decline to $1.16 and potentially $1.00.
Author

Sheldon McIntyre, CMT
Independent Analyst
Sheldon has 24 years of investment experience holding various positions in companies based in the United States and Chile. His core competencies include BRIC and G-10 equity markets, swing and position trading and technical analysis.



