Top 3 Gainers: OMG, SXP, and STORJ explode 70% and are eying up more gains
- OMG is up by more than 70% in the past few days after a robust rebound.
- The recently Binance-acquired finance app Swipe also saw massive 77% gains in the past four days.
- Similarly, STORJ is up by 76% in the past three days.

The entire cryptocurrency market is bouncing back up, strongly gaining more than $28 billion in market capitalization over the past week. Some of the biggest gainers include OMG, SXP, and STORJ.
All three cryptocurrencies saw massive gains over the past week outperforming major coins like BTC or ETH.
Can OMG climb back up to its 2020-high at $6.7?
OMG was trading as low as $2.48 on September 21. After a strong bounce, the digital currency peaked at $4.43, a 78% price surge in about one week. Several indicators still show more substantial support than resistance for the scaling platform.
OMG/USD 12-hour chart
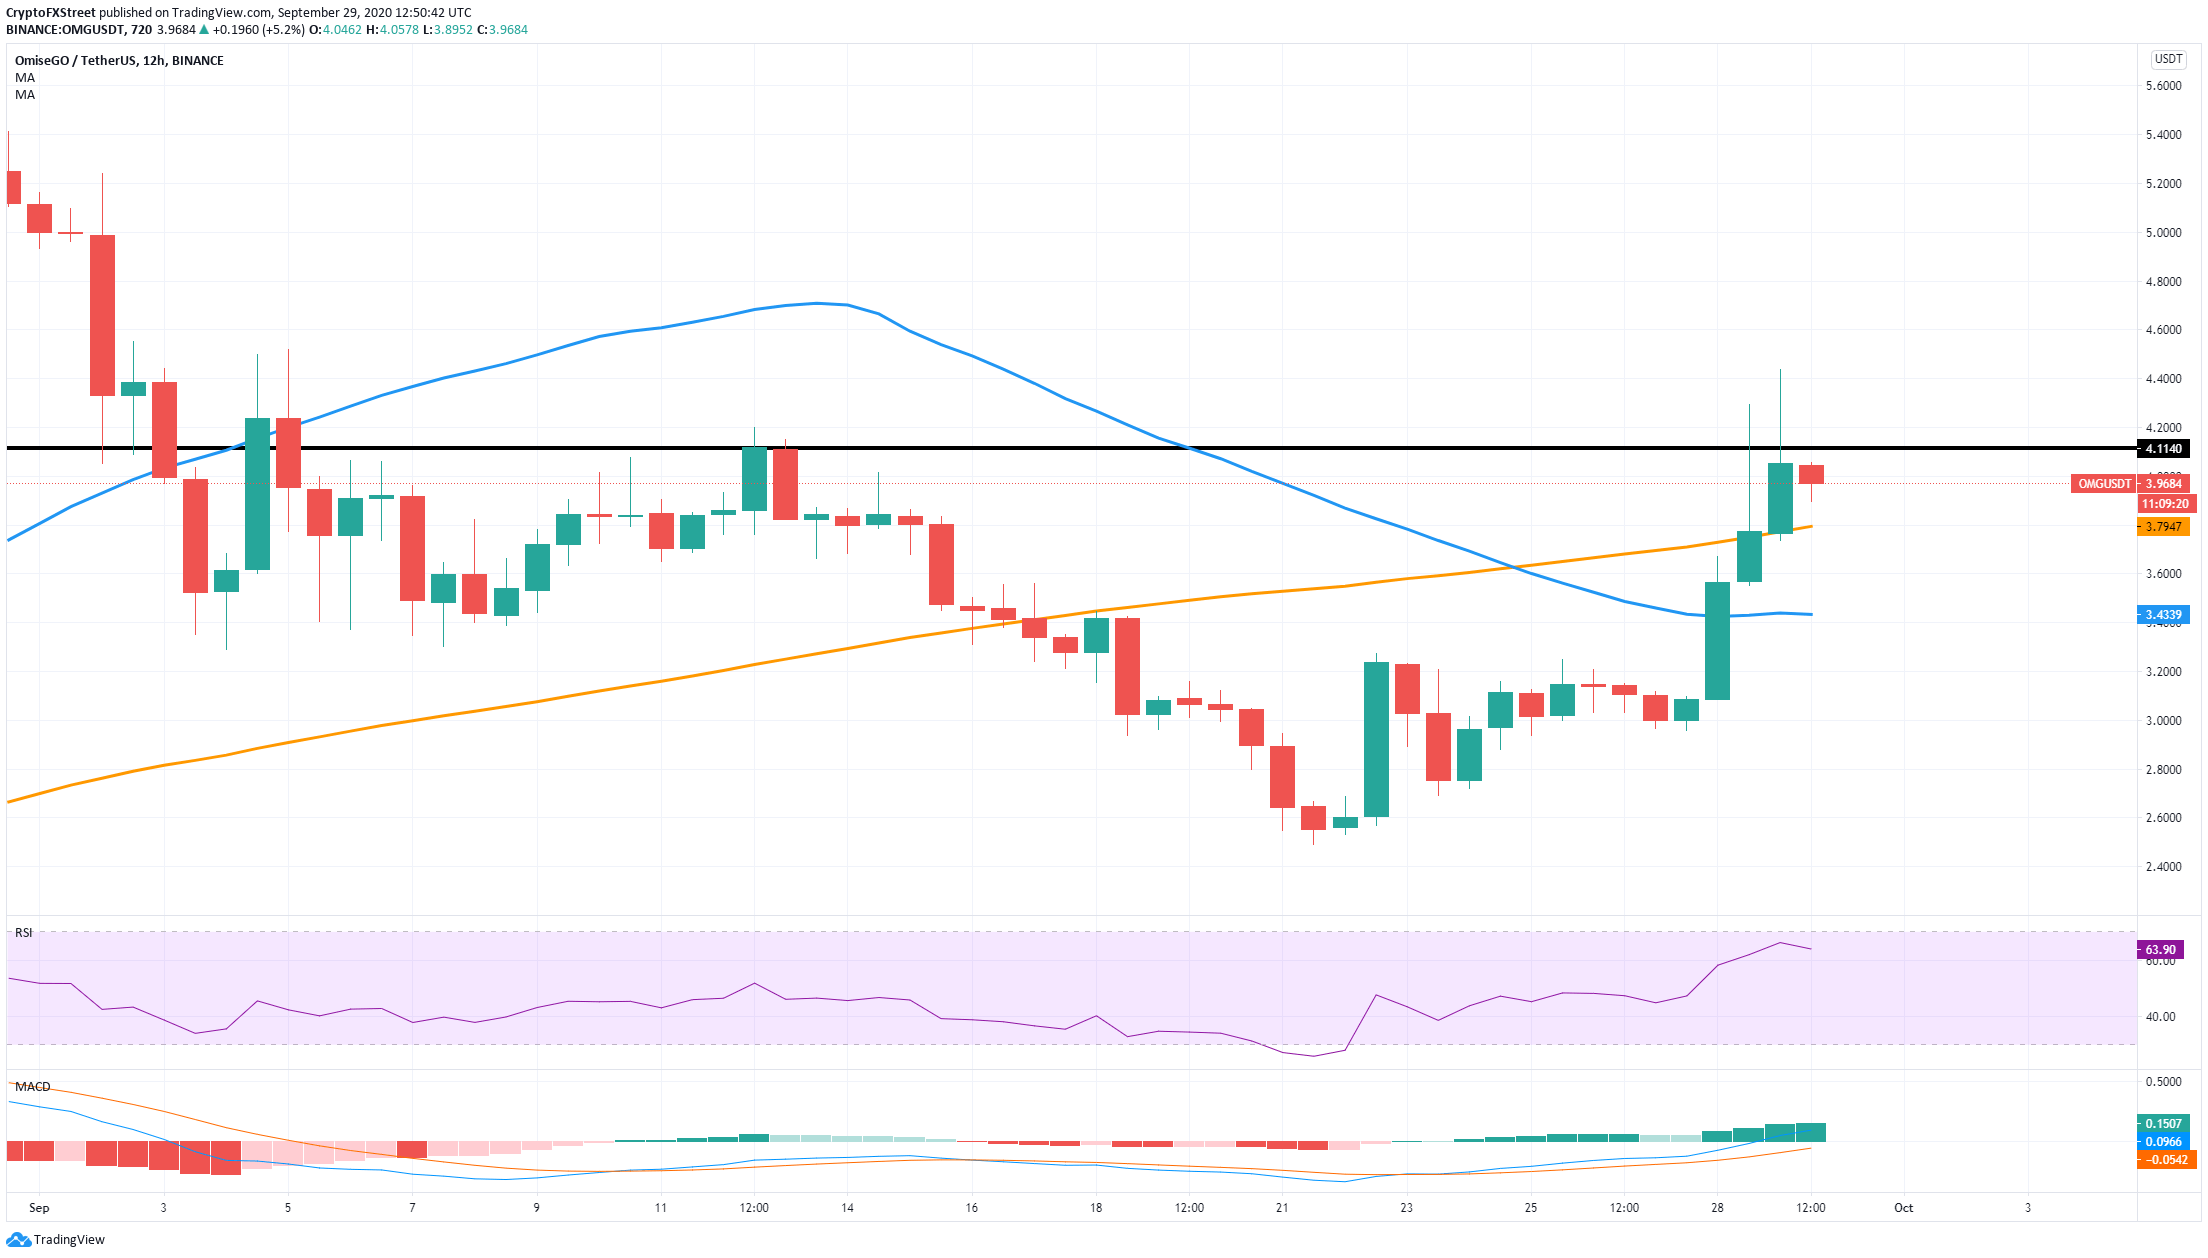
On September 28, the price climbed above the 50-MA at $3.4, turning into support. OMG also managed to turn the 100-MA into support and could be looking for a small re-test before the next leg up. There is some resistance at $4.2, a high established on September 12.
OMG IOMAP Chart
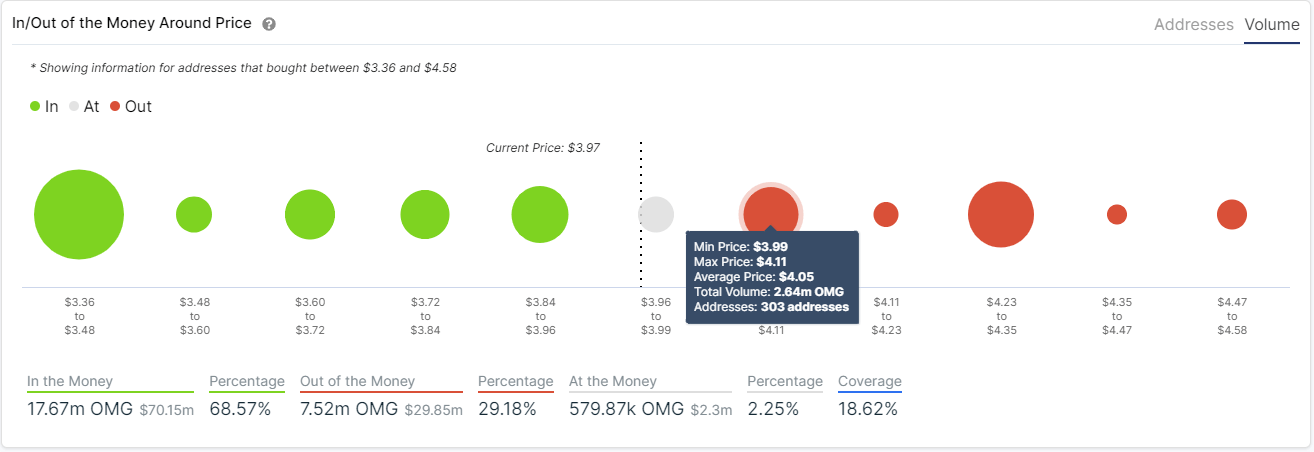
If we look at the In/Out of the Money Around Price chart by IntoTheBlock, we can see the next notable resistance point between $3.99 and $4.11. In this range of prices, around 2.6 million OMG coins were bought. The next resistance level seems to be between $4.23 and $4.35.
OMG Holders Distribution
 [14.45.34, 29 Sep, 2020]-637369819383900620.png)
The holders distribution chart shows conflicting statements as the number of whales holding between 1,000,000 coins and 10,000,000 coins has increased by one. This growth is notable because the minimum amount of 1 million coins equals around $4 million. On the other hand, the number of smaller holders with at least 100,000 coins decreased from 78 to 75.
It’s important to realize that the highest amount of support for OMG is located between $3.36 and $3.48, according to the IOMAP chart. In this zone, 10.4 million coins were bought. A slip below the 12-hour 100-MA could easily take OMG down to $3.4. On the flip side, if $4.2 is broken, the digital asset will run free as the resistance above this point is comparatively lower.
Swipe still trying to recover from its dip after the Binance acquisition
The leading cryptocurrency exchange, Binance, announced the acquisition of Swipe back in July. Initially, the news worked out great for the digital currency, which exploded from an average price of $0.5 to a peak of $5. Unfortunately, the rally was short-lived, and SXP is still down 67% from that high.
SXP/USD 12-hour chart
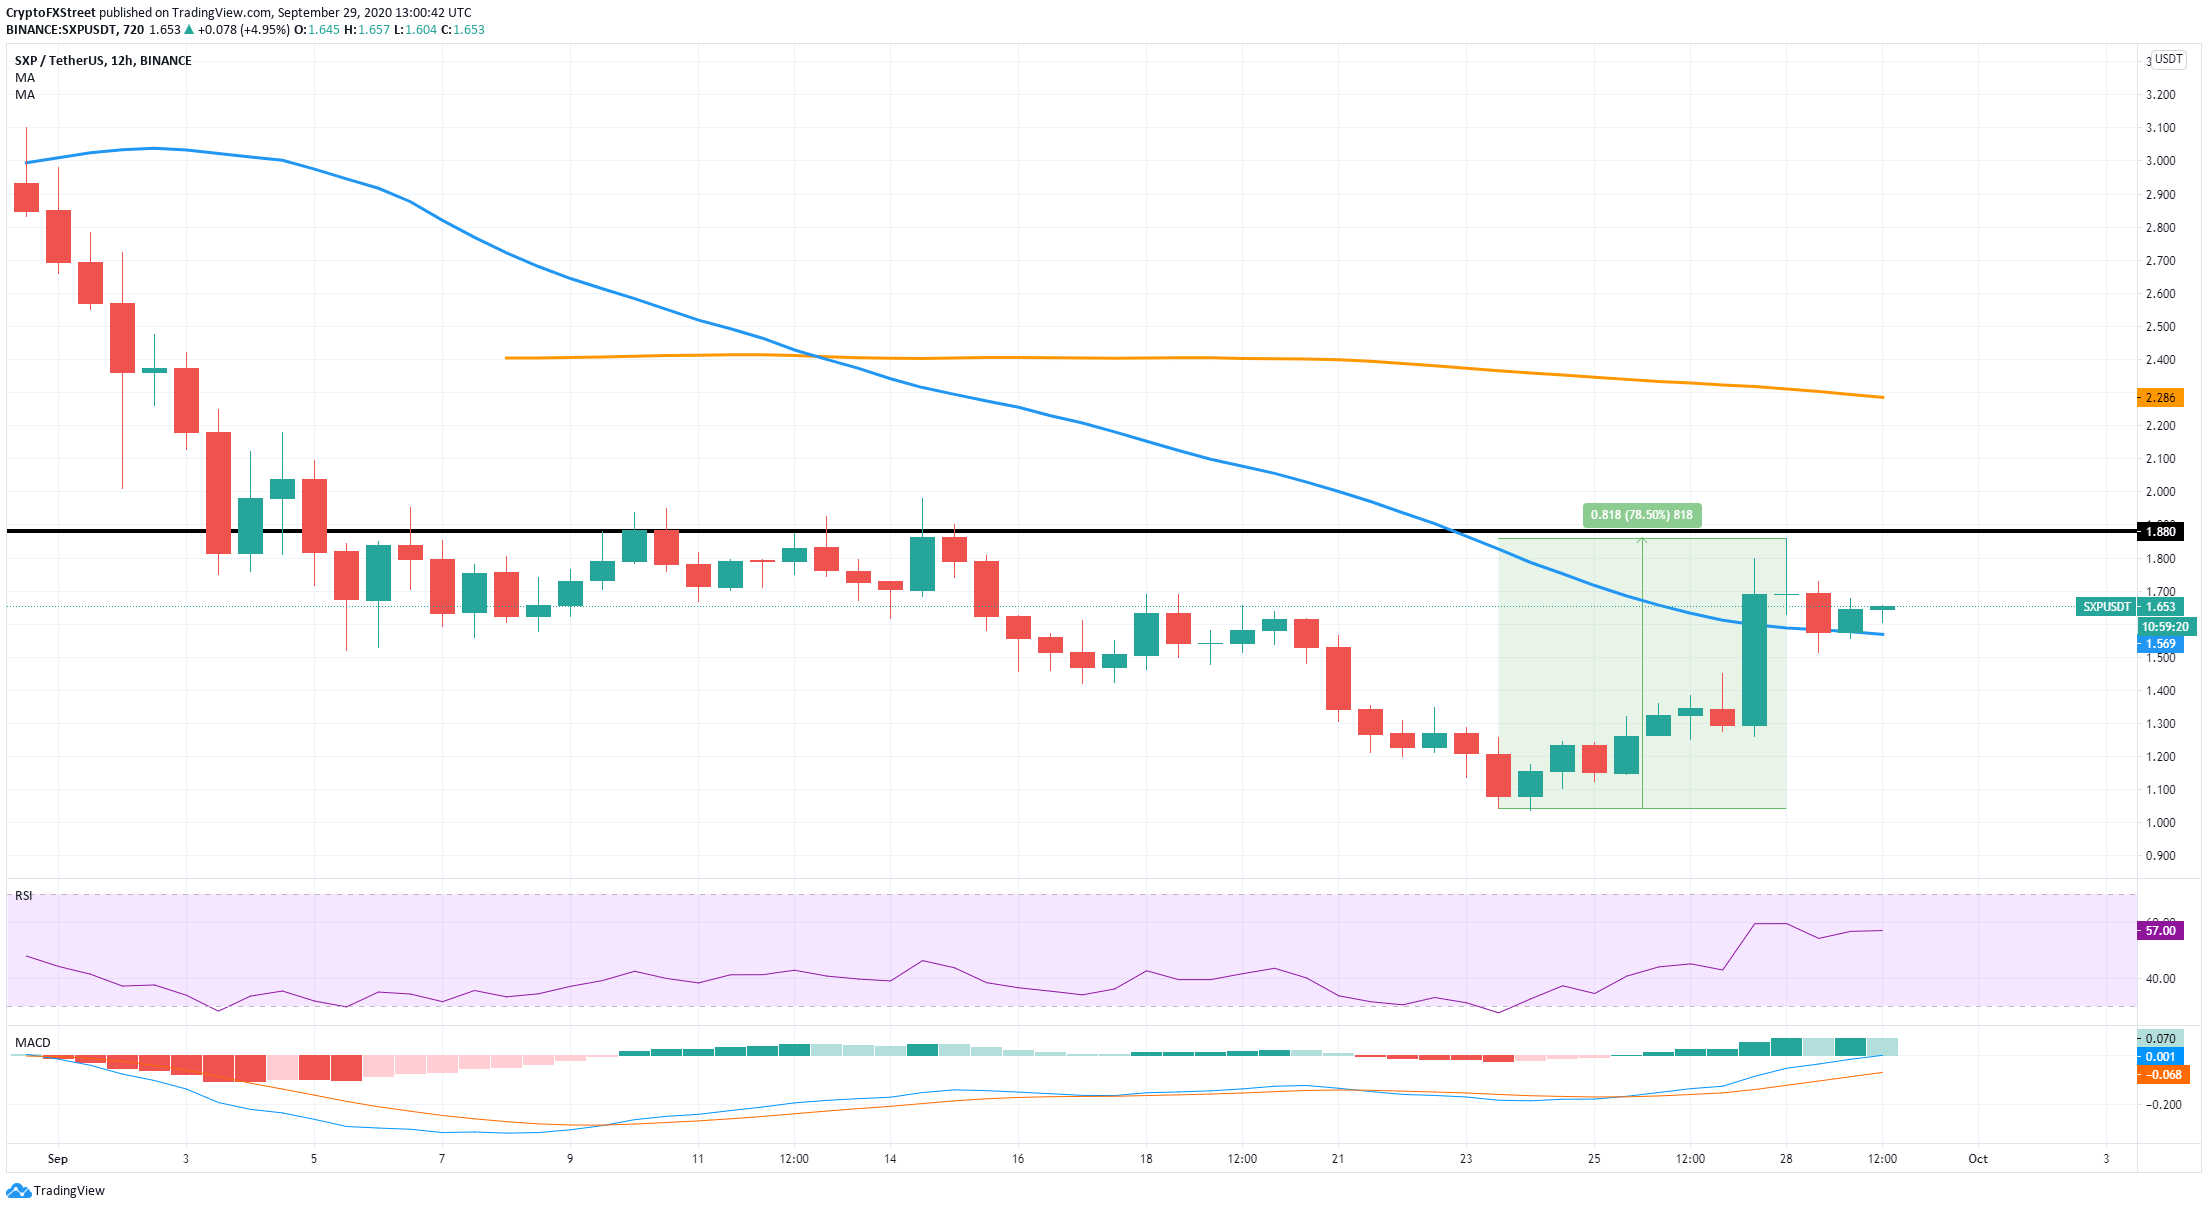
The recent rebound of September 24 took SXP from a low of $1.17 to a high of $1.86 in less than a week. Bulls have managed to turn the 50-MA into support and are looking for the next resistance level, located at $1.9. This level has acted as the resistance between September 6 and September 15, rejecting the price several times.
SXP IOMAP Chart
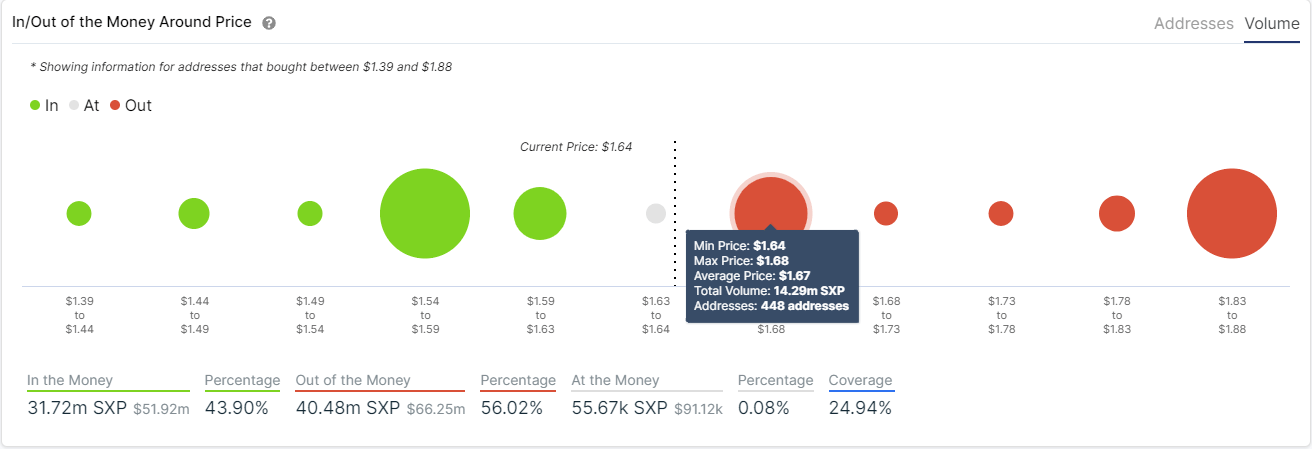
The IOMAP chart shows strong resistance between $1.64 and $1.68, where 14 million SXP coins were bought by close to 450 addresses. If this level is broken, the digital asset can easily climb towards $1.8, where the next resistance area is located according to the IOMAP.
The most critical support level is located at $1.56, where the 50-MA on the 12-hour chart is established. Additionally, the IOMAP chart also shows this to be a substantial support area. It also indicates that SXP would trade in a free fall if this support is broken, as not many investors bought below this point.
Several indicators show STORJ is poised for a pullback
After a massive 76% rebound from its low at $0.31, STORJ is looking at a possible correction period according to several indicators.
STORJ/USD 12-hour chart
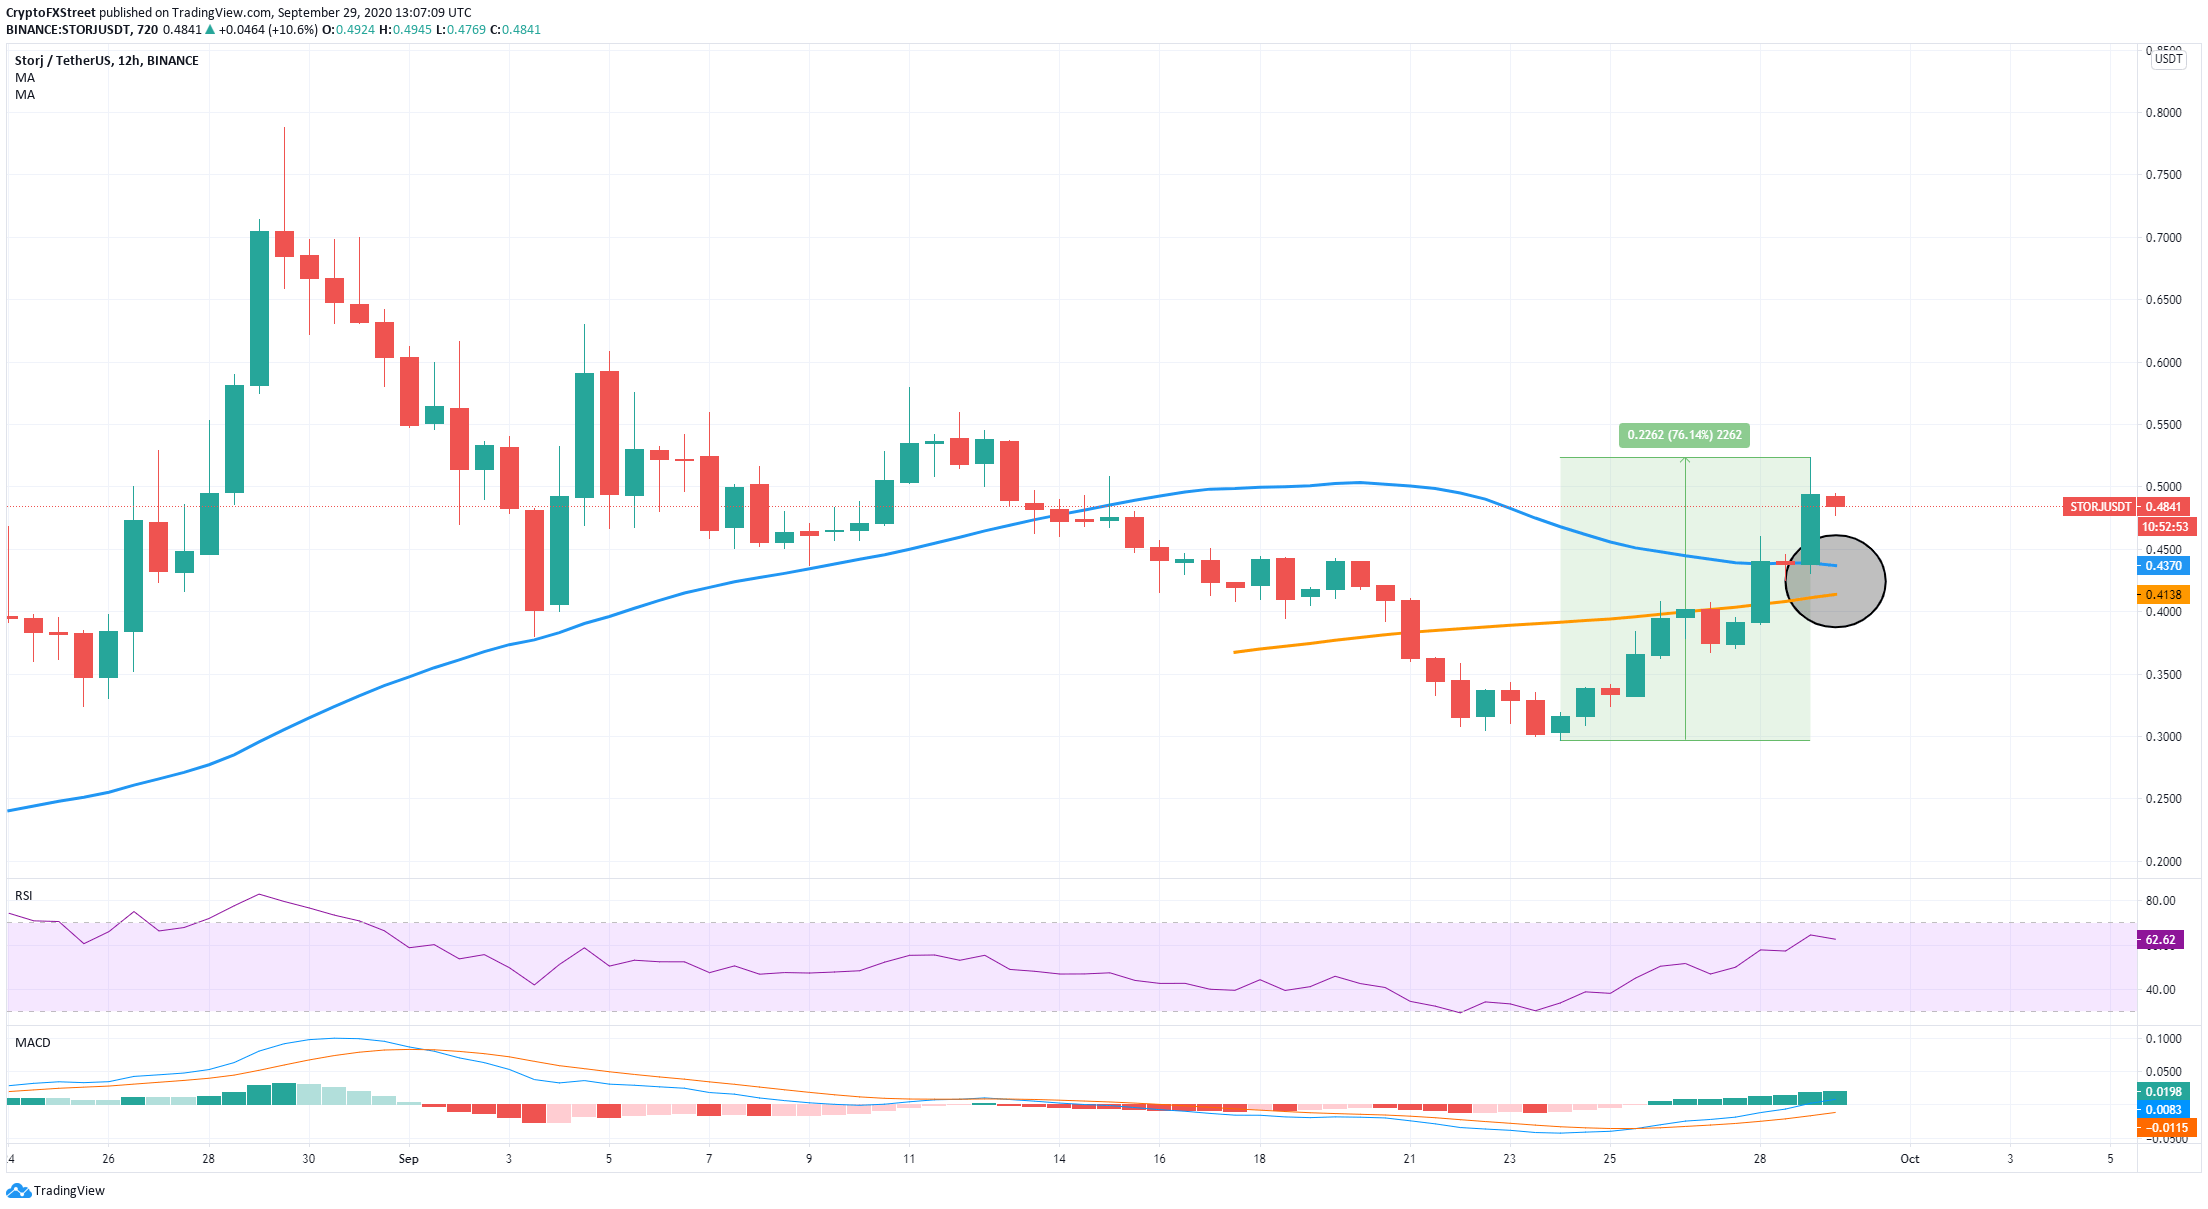
The RSI is getting closer to overextension levels while the price of STORJ continues climbing. Bulls have turned both the 50-MA and 100-MA into support levels, however, a re-test of the 50-MA is likely according to the IOMAP chart.
STORJ IOMAP Chart
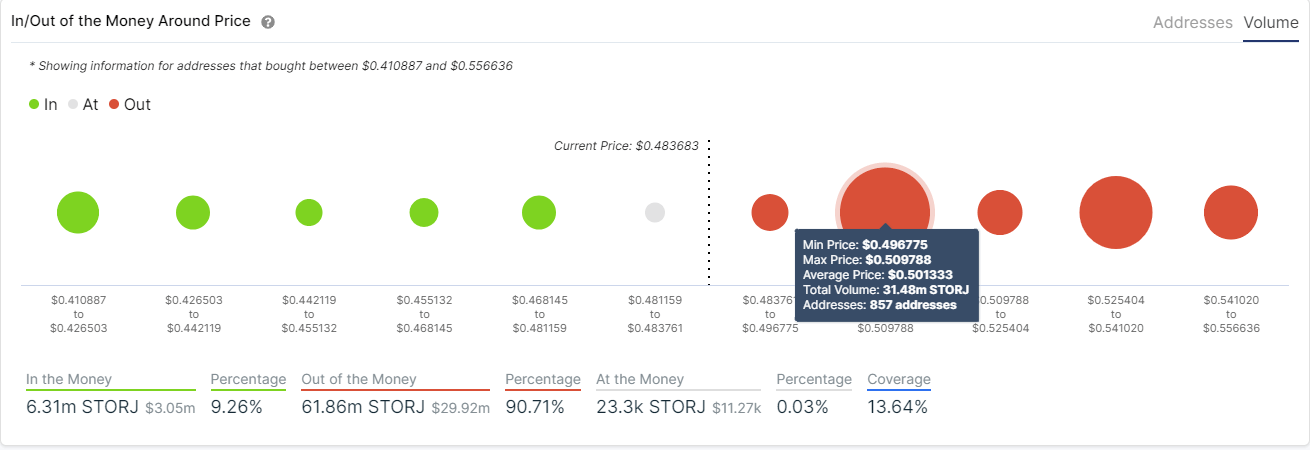
The most notable fact we can observe using the IOMAP chart is how much smaller support is compared to resistance. Between $0.49 and $0.50, more than 800 addresses bought 31 million STORJ coins. This number is bigger than all coins purchased between $0.41 and the current price. The decentralized cloud storage platform seems to be poised for a pullback that could extend down to the 100-MA on the 12-hour chart.
Cracking the massive support area between $0.49 and $0.50 will take STORJ up to at least $0.52 where the next resistance point is located.
Author

Lorenzo Stroe
Independent Analyst
Lorenzo is an experienced Technical Analyst and Content Writer who has been working in the cryptocurrency industry since 2012. He also has a passion for trading.


