OmiseGo Price Prediction: OMG price surges 30% and it’s looking for more
- OMG is currently trading at $3.08 after a massive 27% price pump within 12 hours.
- The TD sequential indicator has presented several strong buy signals for OMG.

OMG is down more than 50% since its two-year high at around $7 was established in August 2020. Bulls are finally seeing a bounce for the digital asset and look forward to more price action in the short-term as several indicators are flashing buy signals.
OMG/USD daily chart
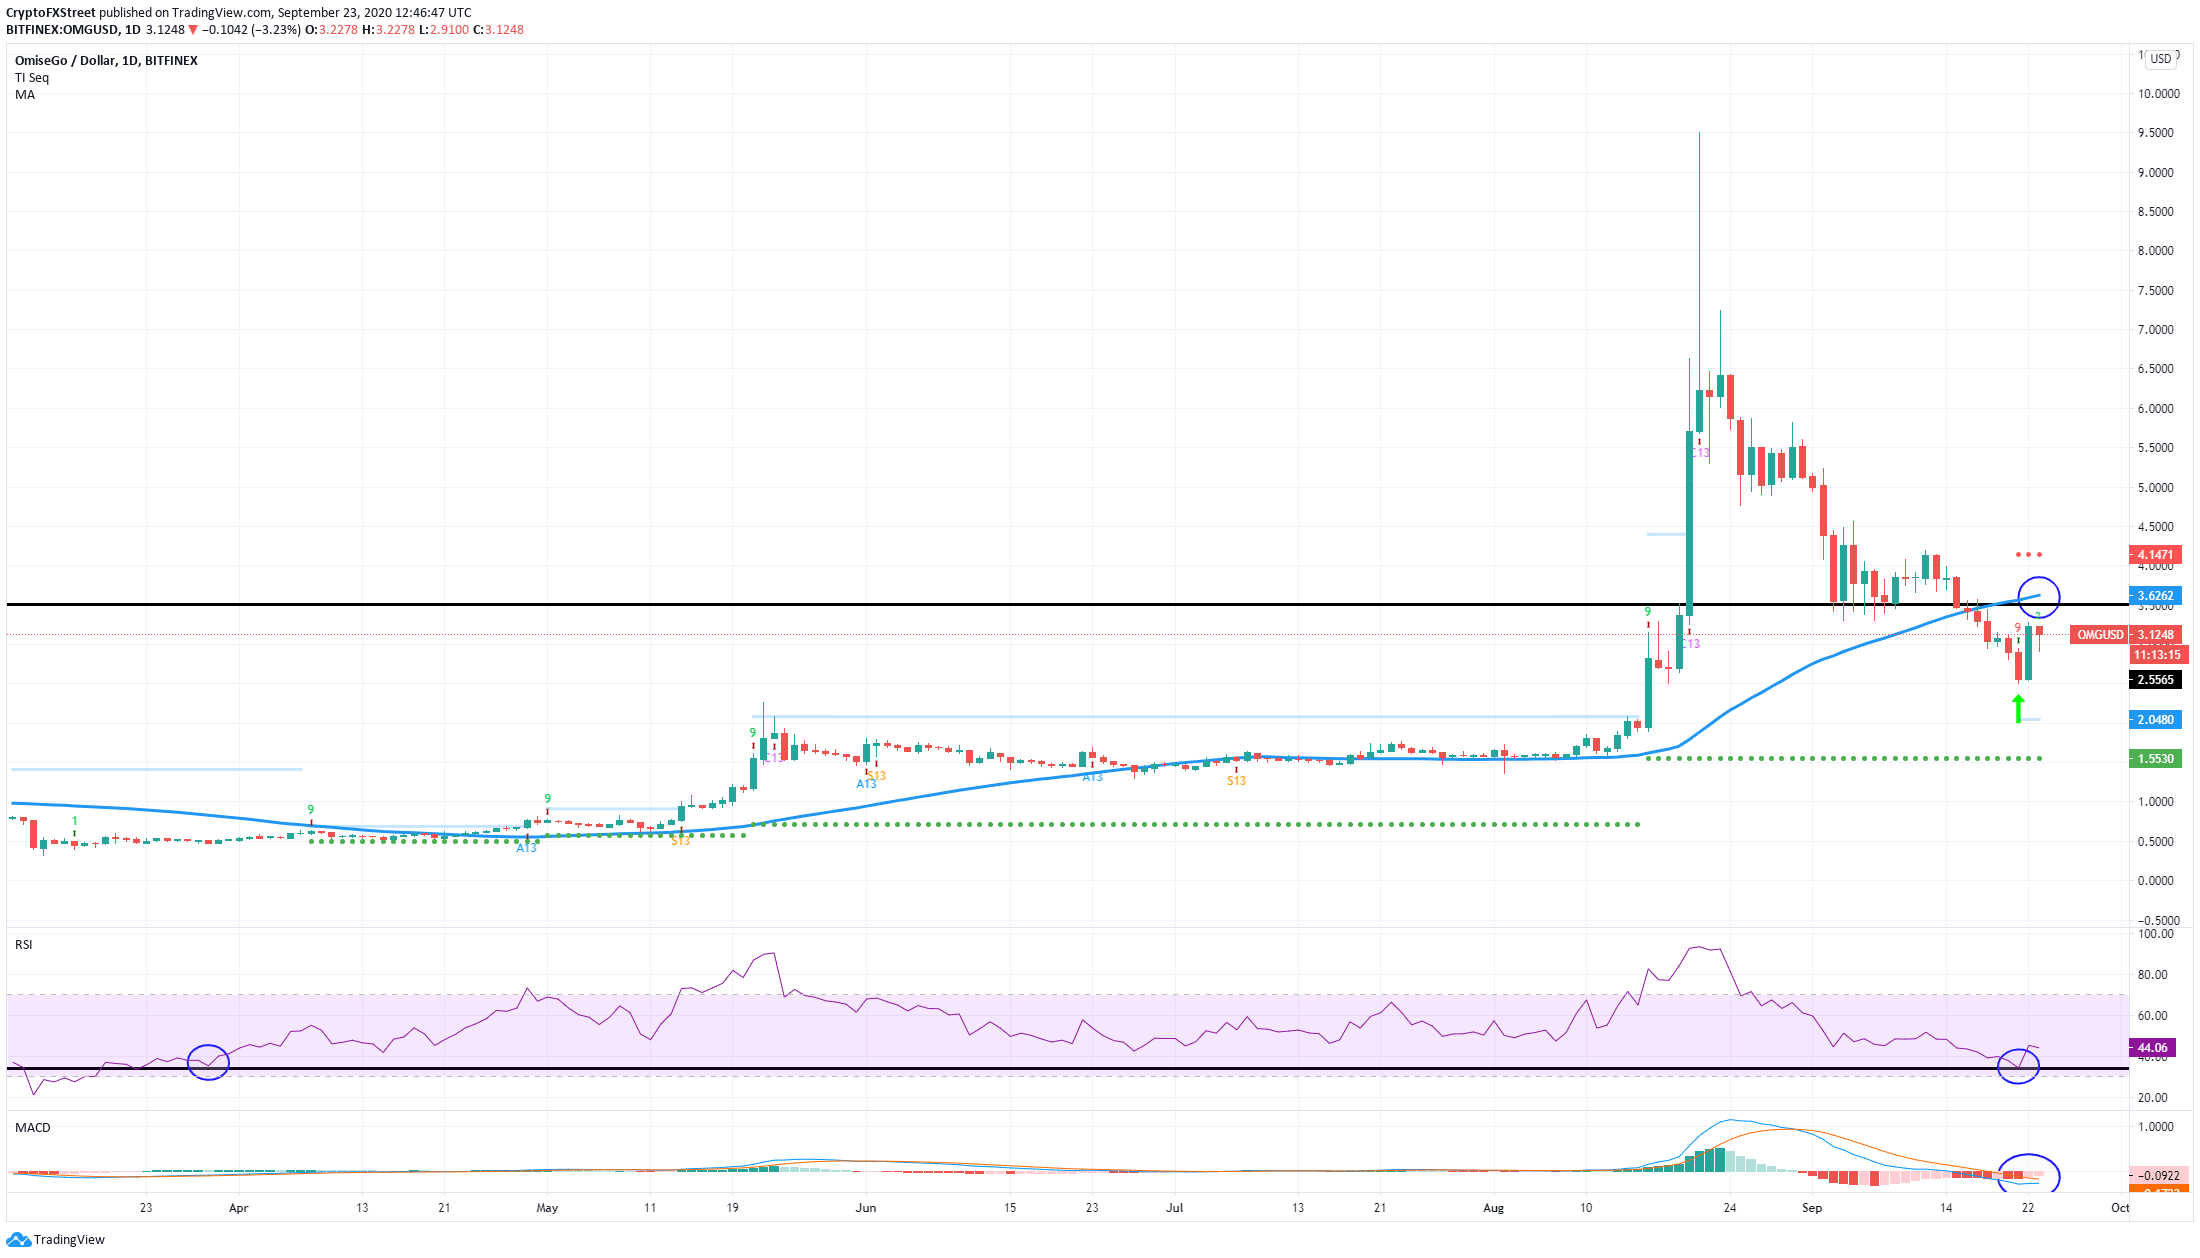
The non-custodial cryptocurrency is clearly trading inside a massive downtrend; however, the TD sequential indicator has presented a strong buy signal at around $3. Additionally, the RSI touched 33, a value not seen since March 2020, indicating a possible strong rebound in the short-term. The MACD remains bearish but is on the verge of a bull cross if buyers can keep up the momentum.
OMG Weighted Social Sentiment Chart
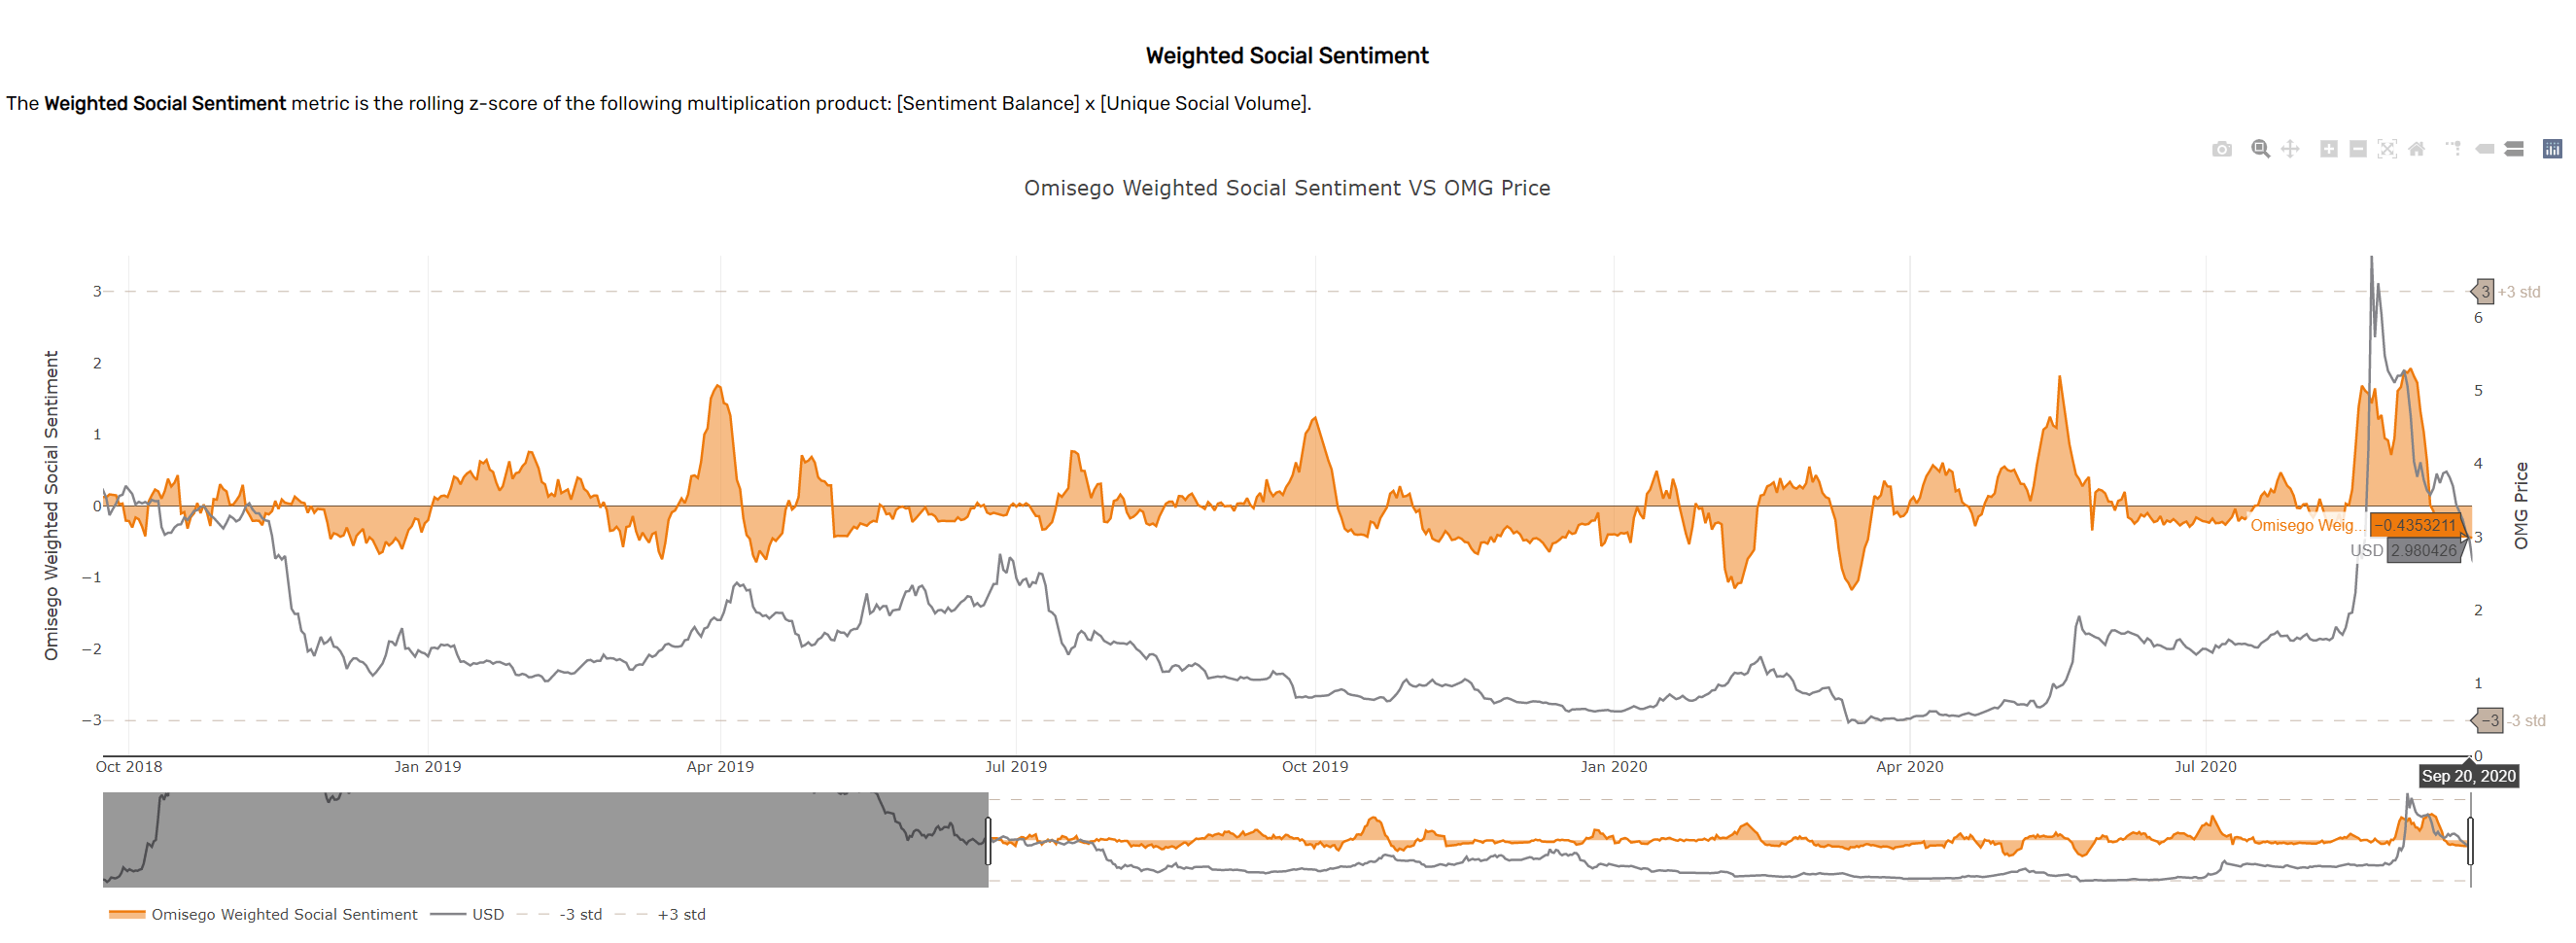
In its most recent insight report, Santiment, an on-chain analytics platform, gave OMG an average rating of 6.6, which means it’s slightly bullish. One of the metrics used to get this rating was the weighted social sentiment, which determines how people view the digital asset. Looking at the chart, it seems that the negative sentiment on OMG has been slowing down recently, perhaps indicating that investors are speculating whether the bottom is in or not.
OMG IOMAP Chart
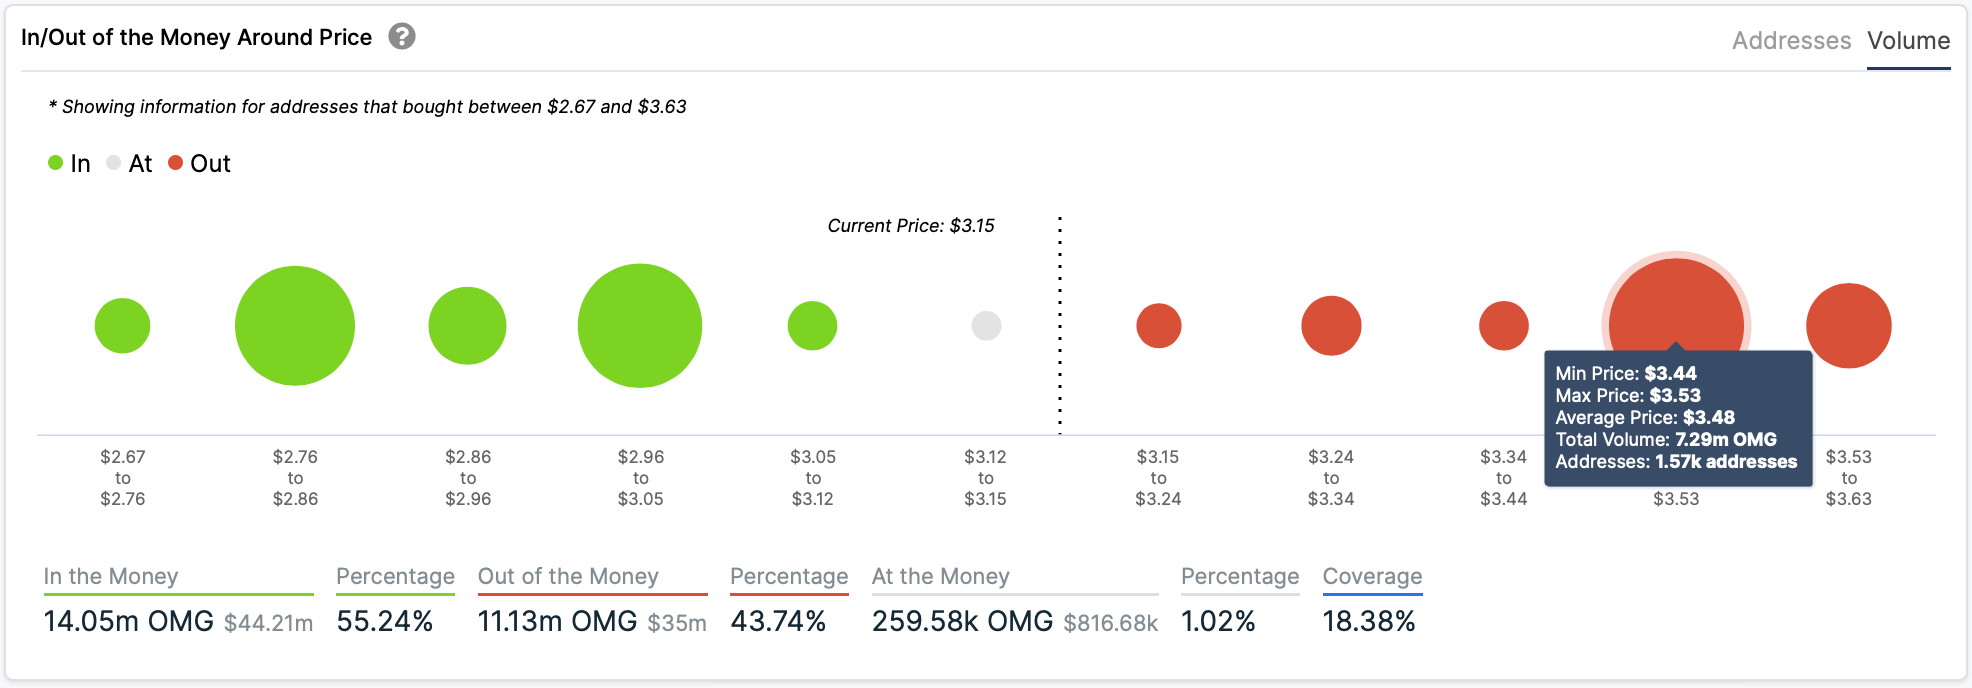
According to the In/Out of the Money Around Price chart by IntoTheBlock, this could very well be the case. The chart shows a massive amount of support at around $3, as many investors bought there. On the other hand, not many bought OMG well until $3.5, which could mean that the price is free to run up to at least that resistance level. Additionally, the 50-SMA almost coincides at the same level.
OMG/USD 12-hour chart
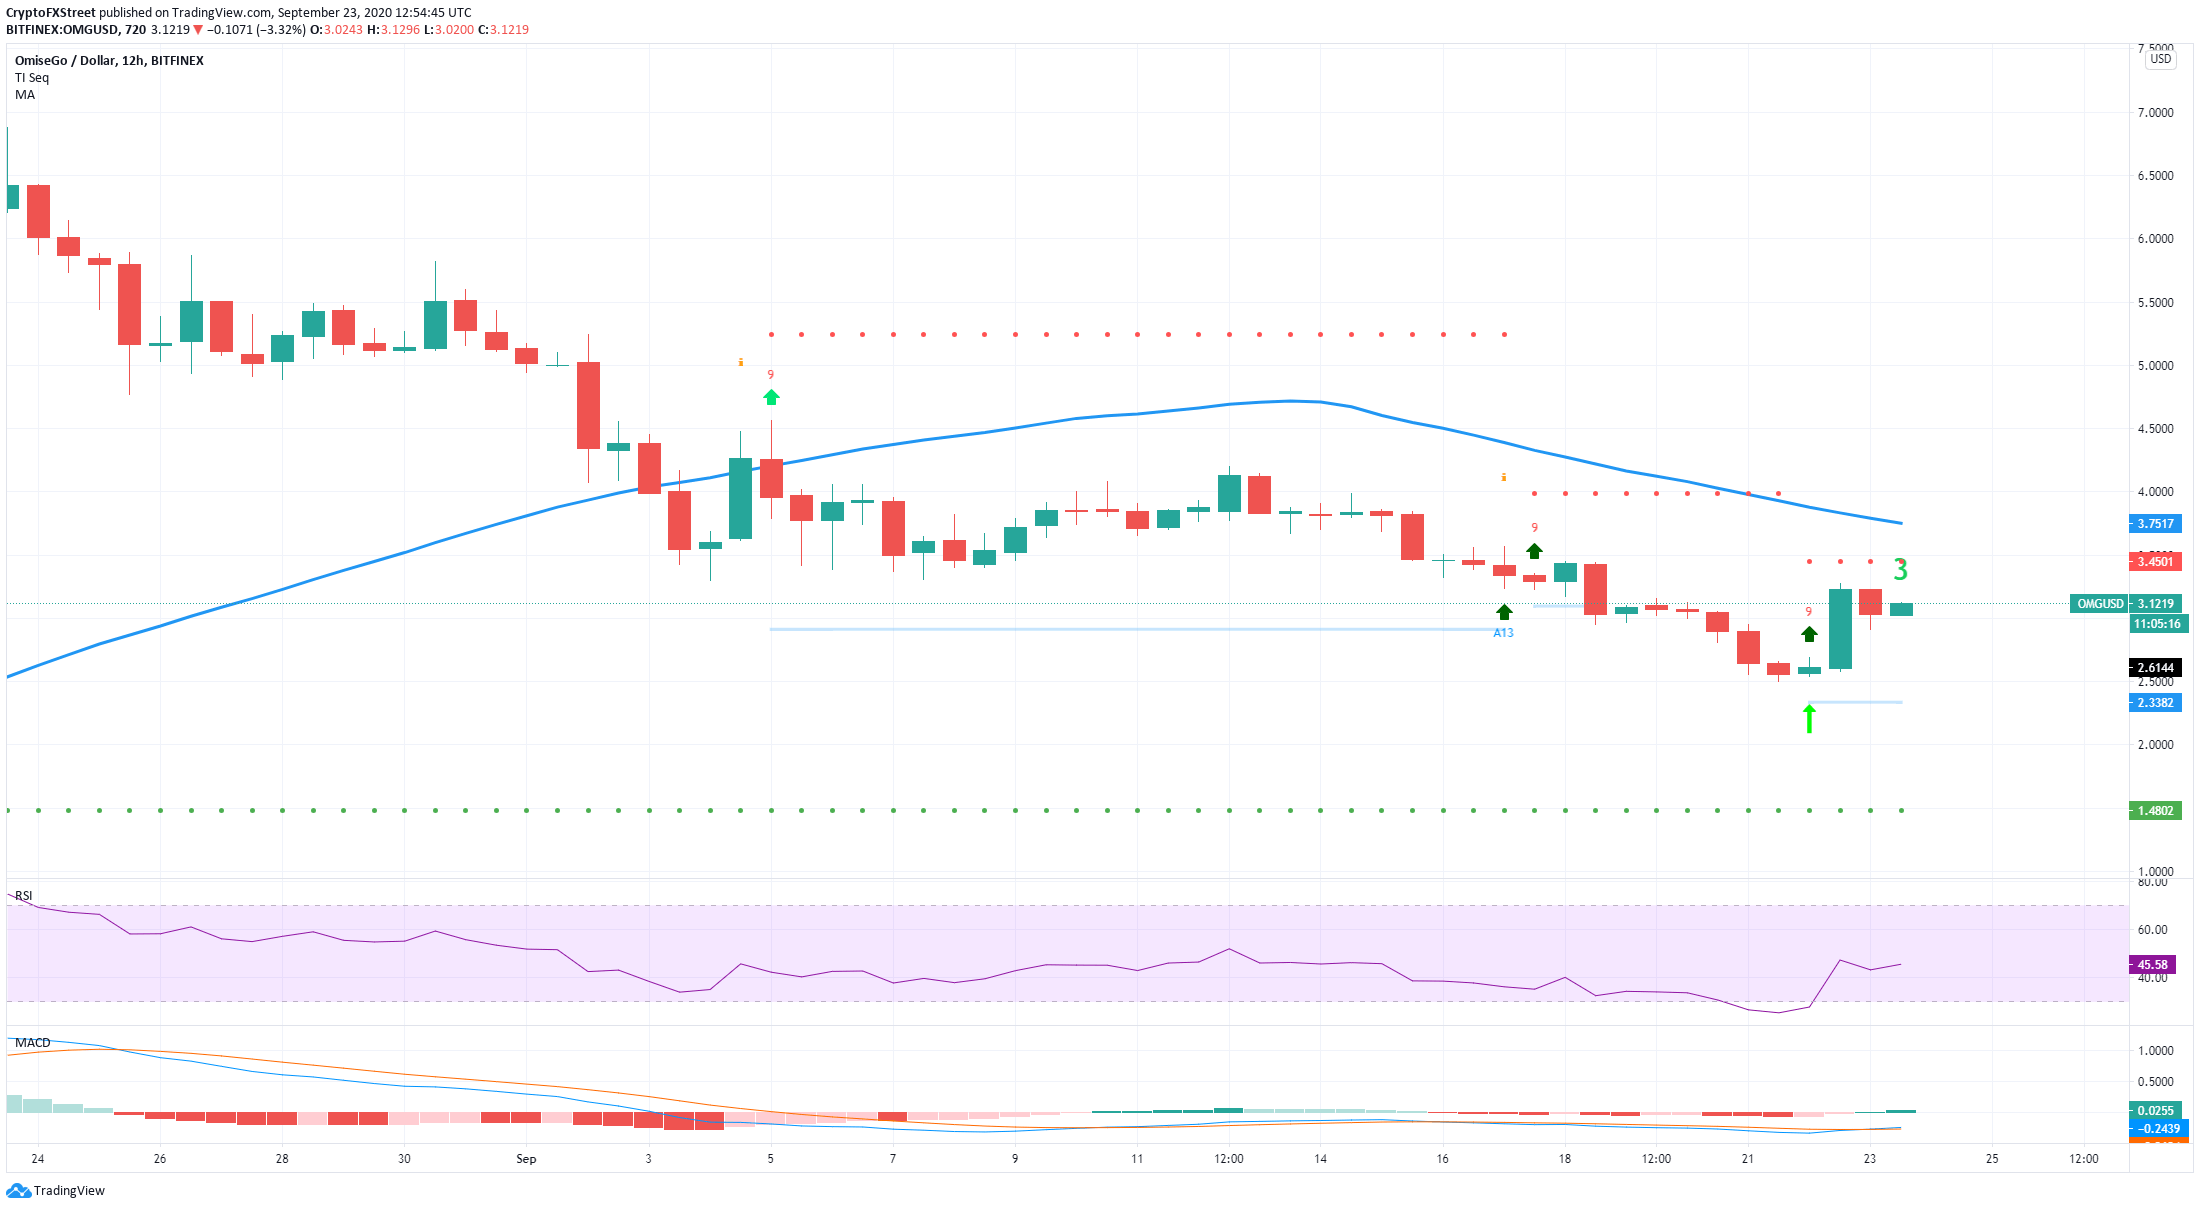
Similarly, on the 12-hour chart, the TD sequential indicator has also presented a firm buy signal at $2.6. The RSI here did get overextended at 26, which usually means a strong rebound, especially considering the MACD also turned bullish. The same resistance level at $3.5 can be applied here; however, the 50-SMA is up at $3.75.
OMG New Addresses
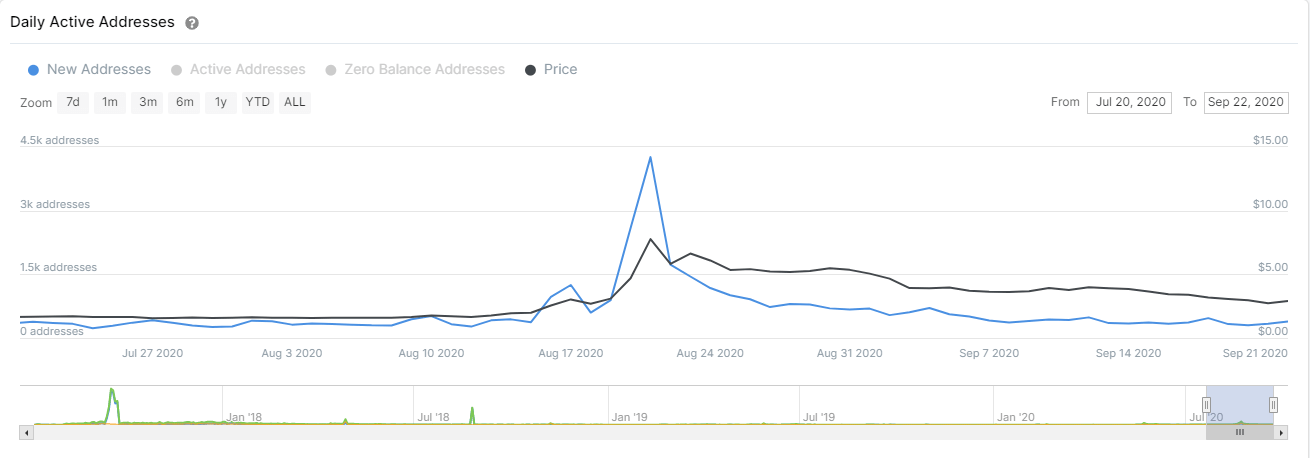
Although the IOMAP chart above shows significant support at $3 and below, bulls can’t get too confident. The number of new addresses for OMG peaked in August but has been declining since then, a relatively bearish indicator.
Investors need to pay close attention to the current price action of OMG and $3.5 as the next most crucial resistance level. If the price can climb above $3.5, the digital asset could be aiming even for $4. On the other side, the support at $3 is quite important in the short-term. If it breaks, OMG will slip towards the next support area at $2.8.
Author

Lorenzo Stroe
Independent Analyst
Lorenzo is an experienced Technical Analyst and Content Writer who has been working in the cryptocurrency industry since 2012. He also has a passion for trading.


