Three reasons why SafeMoon price might rally 60% soon
- SafeMoon price dipped below the May 23 swing low to form a new bottom at $0.00000257.
- A reversion to the mean indicates a 60% upswing.
- The RSI has dipped below the oversold zone, further strengthening the bounce-back narrative.

SafeMoon price has experienced a massive sell-off since June 15 as it deviated below its previous range low established on May 23. However, this deviation is likely to revert to the mean, providing an excellent opportunity for an uptrend.
SafeMoon price likely to revert to mean
SafeMoon price created a range as it dropped 60% from $0.00000682 to $0.00000257. Since this vast crash, SAFEMOON briefly reverted to the 50% Fibonacci retracement level of this range at $0.00000478.
The inability of the buyers kept SafeMoon price below this level for most of the time. Similar reversion to the mean takes place when a significant price move occurs, regardless of the direction.
The recent sell-off pushed the range low to $0.00000257. AlthoughSafeMoon price has risen 24% over the past 12 hours, more of this ascent is likely to occur shortly.
Therefore, investors can expect SAFEMOON to retest the 50% Fibonacci retracement level at $0.00000470, roughly a 60% rally from the support level at $0.00000295.
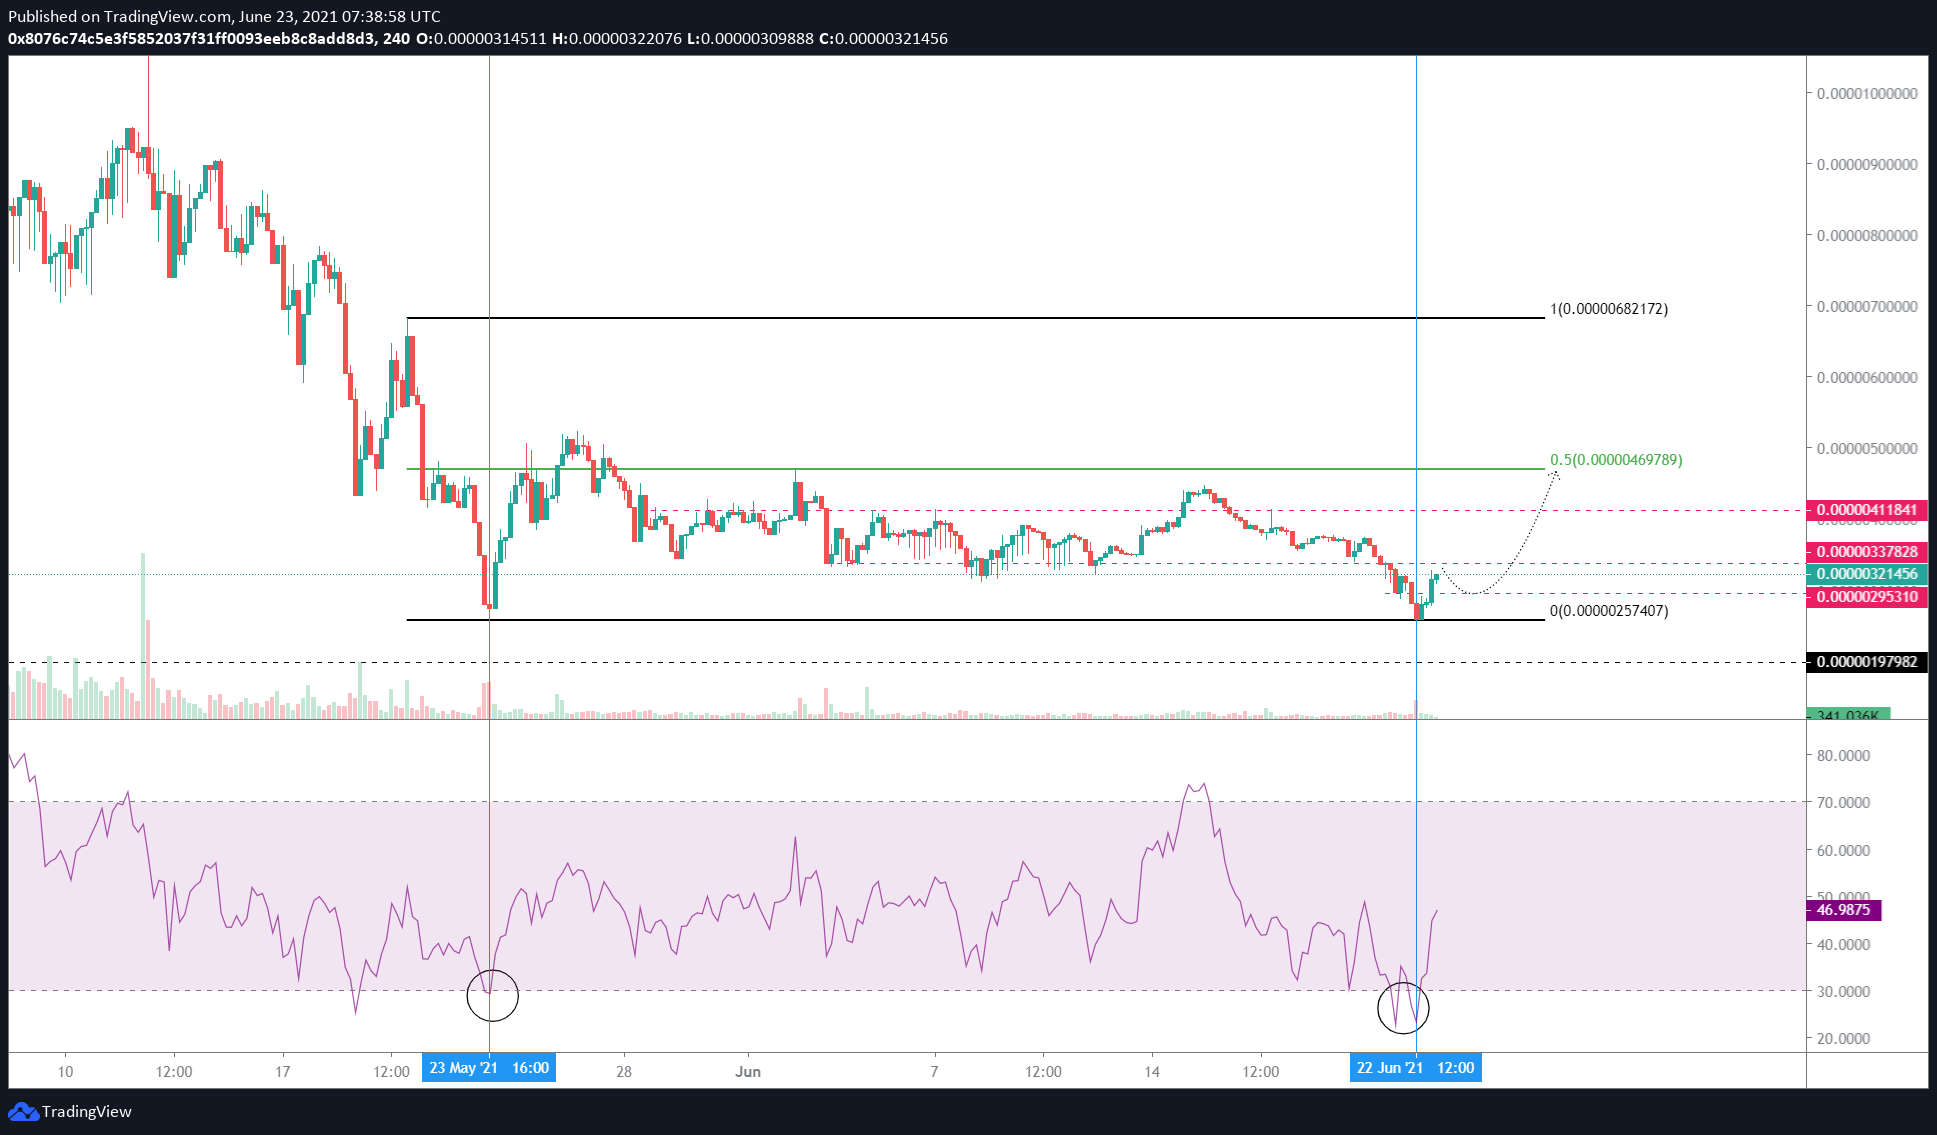
SAFEMOON/USDT 4-hour chart
RSI dips into oversold region
Moreover, crashing 30% between June 20 and June 22 pushed SafeMoon price to create a new range low and dragged the Relative Strength Indicator (RSI) below 30, the oversold level.
The last time RSI dipped below 30 was on May 23, which was followed by an 88% rally, which swaggered through the mean.
Although RSI has climbed to 46, if something similar were to happen, a 60% upswing to the 50% Fibonacci retracement level at $0.00000469 seems likely.
Bitcoin, general cryptocurrency market hints at move higher
The mean reversion theory holds for Bitcoin price as well. Considering the massive correlation that altcoins generally have with BTC, it is likely to assume that a swift move up in the flagship crypto’s market value will likely trigger the altcoins to do the same, including SAFEMOON.
This relation depends mostly on Bitcoin’s dominance, which measures how much of the total cryptocurrency market comprises BTC.
In a nutshell, it is the ratio of the market capitalization of Bitcoin to the altcoins. Generally, a decrease in Bitcoin dominance paves the way for altcoin season, and the opposite makes altcoins heavily correlated with BTC.
Over the past month, the dominance chart has set up two higher highs, indicating a steady growth and further adding credence to the bullish thesis for SAFEMOON.
After the recent sell-off, the flagship cryptocurrency has positioned itself for a move higher; therefore, investors can expect SafeMoon price to do the same as well.
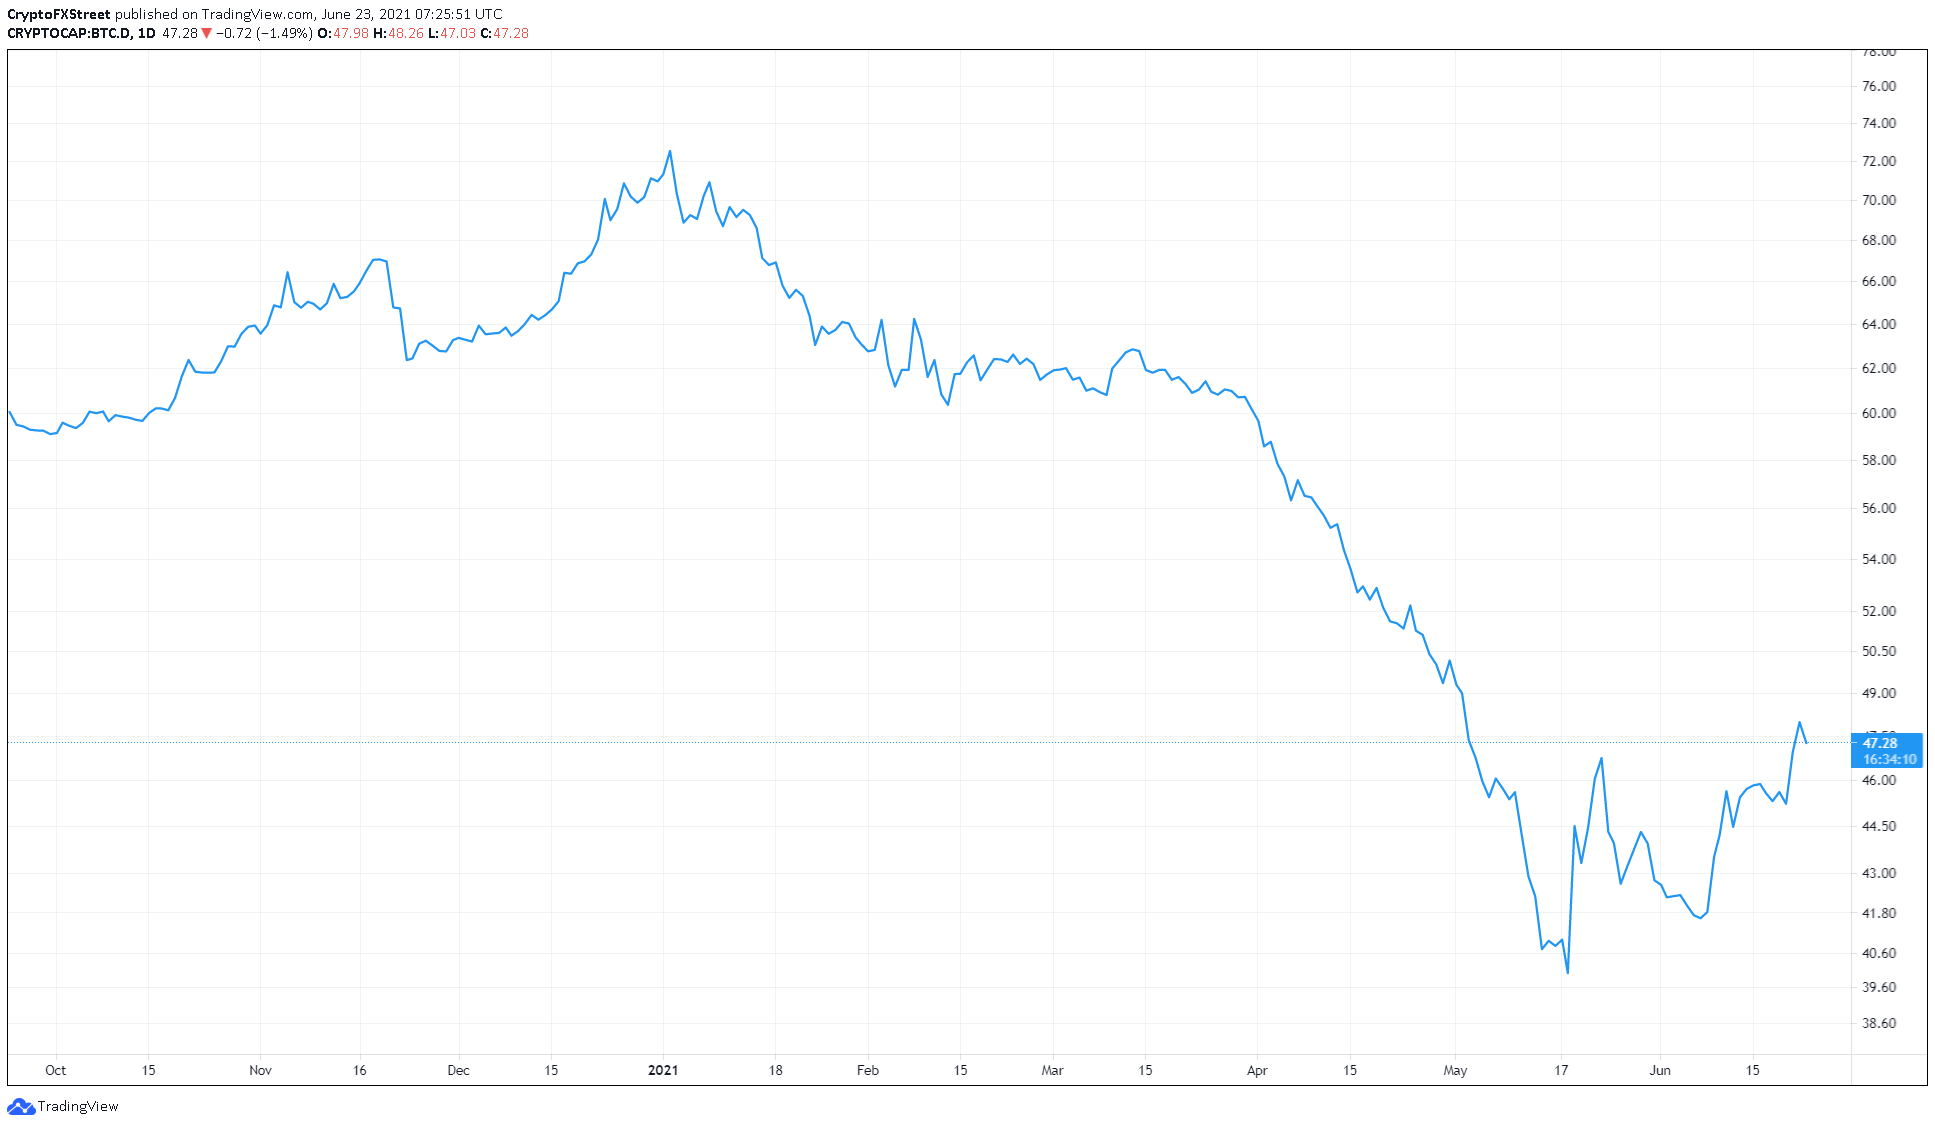
BTC.D 1-day chart
To conclude, the technical perspective indicates that SafeMoon price is likely to head higher. However, the resistance levels at $0.00000338 and $0.00000412 will play a pivotal role in deciding if the rally reaches its intended target at $0.00000470.
Rejection at any of these levels leading to a decisive 4-hour candlestick close below the range low at $0.00000257 will invalidate the bullish thesis.
In this case, SAFEMOON might dip 23% to the immediate support level at $0.00000198.
Author

Akash Girimath
FXStreet
Akash Girimath is a Mechanical Engineer interested in the chaos of the financial markets. Trying to make sense of this convoluted yet fascinating space, he switched his engineering job to become a crypto reporter and analyst.


