Three reasons why Ethereum price drop to $4,000 may have been the local bottom
- Ethereum price may have formed a local bottom at $4,000, according to a critical technical indicator.
- A global investment bank forecasts ETH to reach $8,000 by the end of the year.
- Nearly 1 million Ether has been burned, as the growth of Ether in circulation continues to be limited.

Ethereum price fell in tandem with other major cryptocurrencies including Bitcoin, dropping to $3,962 on November 18. The second-largest digital asset by market capitalization appears to be recovering slowly from the recent correction. Three critical factors suggest that ETH has marked its local bottom at the $4,000 psychological level as it prepares to target higher prices.
Ethereum price gears up for a massive breakout
After reaching a new all-time high on November 10, analysts are betting on Ethereum price to double in value before the end of 2021. Global investment bank Goldman Sachs predicts that ETH will reach $8,000 by the end of the year.
Goldman Sachs’ forecast for Ethereum price is based on ETH’s historical correlation to inflation. The global bank stated that digital assets have traded in-line with inflation breaks. An inflation break is the difference between the yield of a nominal bond and the inflation-linked bond of the same maturity since 2019.
Goldman Sachs added that cryptocurrencies have tracked inflation markets closely, and potentially reflect the pro-cyclical nature as a “network-based asset.”
While the Ethereum network is transitioning from the proof-of-work consensus mechanism to proof-of-stake, the token’s supply has been continuously burned, with cumulative burned ETH almost about to hit 1 million.
So far, 947,000 ETH has been burned since the London hardfork, reaching nearly $4 billion. An Ethereum upgrade, EIP-1559 came into force earlier this year, introducing a “fee burn” mechanism limiting the growth of Ether in circulation.
According to Edward Moya, senior market analyst at trading platform Oanda, the pace of how tokens are minted has been lowered, which will make Ether more scarce, fueling bullish momentum for Ethereum price.
Ethereum price has recovered from its swing low on November 18, but is confronting a critical resistance barrier at the 78.6% Fibonacci retracement level at $4,191.
The overall outlook for Ethereum price remains bullish, as the cup-and-handle pattern on the daily chart which was validated with a slice above the neckline on October 20 continues to be viable. ETH was able to discover support above the critical neckline of the chart pattern which sits at $3,935.
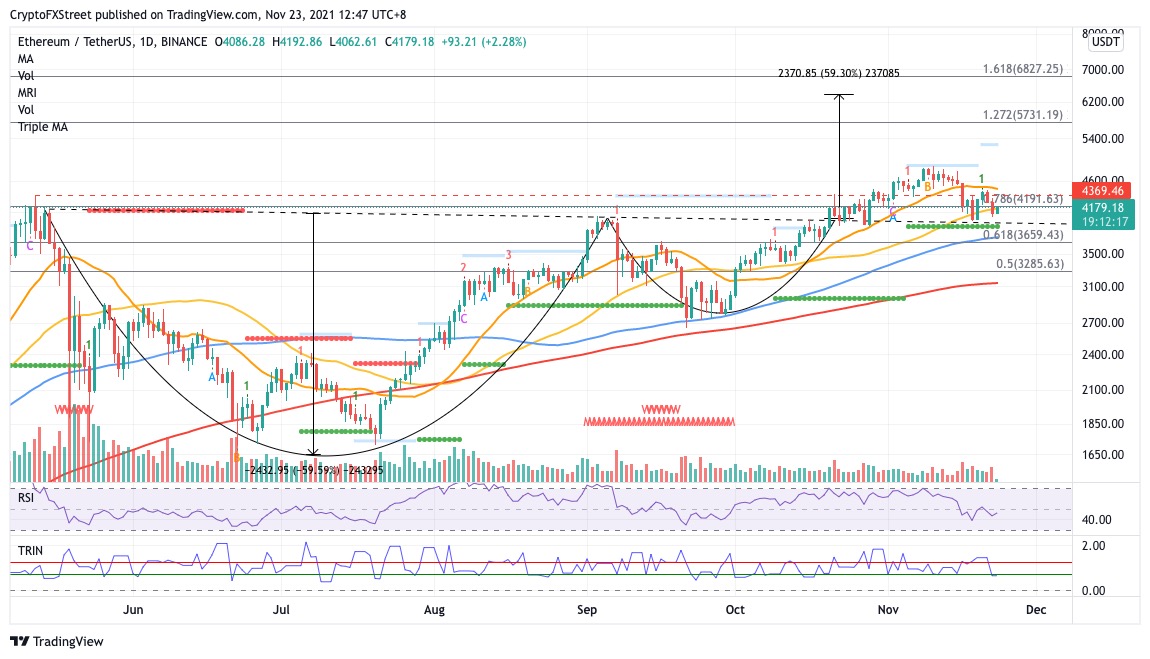
ETH/USDT daily chart
The bullish technical pattern suggests a 59% climb toward $6,363 from the neckline. As long as Ethereum price manages to stay above $3,935, the optimistic target remains on the radar.
If Ethereum price manages to break above the 78.6% Fibonacci retracement level which coincides with the 50-day Simple Moving Average (SMA) at $4,191, the next obstacle for ETH appears to be at the 21-day SMA at $4,478. An additional hurdle will emerge at the all-time high at $4,867 before the token continues with a move higher.
However, if a spike in sell orders occurs, Ethereum price may fall toward the swing low at $3,935 to test the reliability of the support level before dropping toward the MRI’s support line at $3,850.
Author

Sarah Tran
Independent Analyst
Sarah has closely followed the growth of blockchain technology and its adoption since 2016.


