Top 3 Price Prediction Bitcoin, Ethereum, Ripple: Steep correction looms crypto market
- Bitcoin price faces rejection around the $60,000 level, hinting at a potential move to $53,000.
- Ethereum price surge gets undone as the $4,387 hurdle subdues buying pressure.
- Ripple price eyes retest of $1 psychological barrier after a breakout from an ascending parallel channel.

Bitcoin price saw a momentary upswing after its initial downswing on November 18. This quick run-up failed to gather steam, leading to rejection and a retracement. This short-term bearish outlook translated to Ethereum, Ripple and other altcoins.
Bitcoin price approaches another stable support level
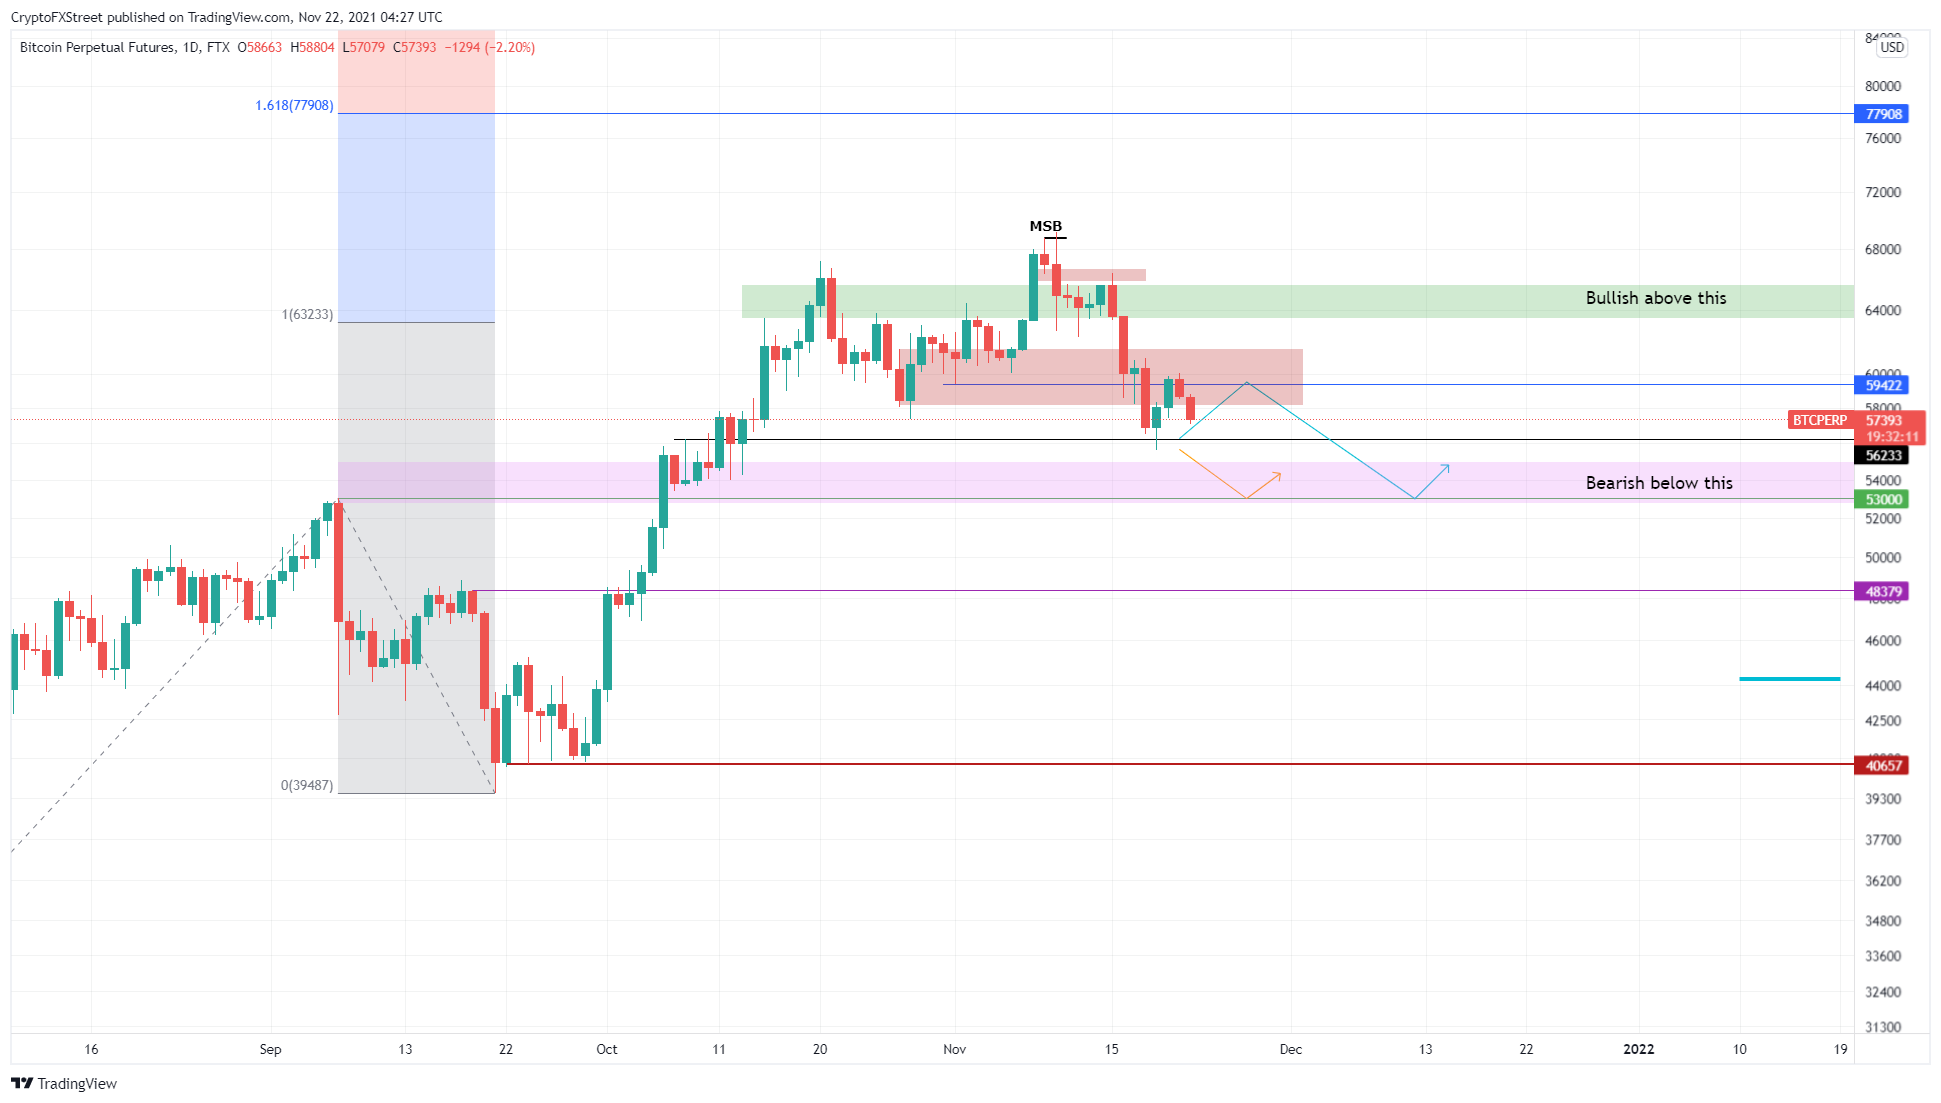
Bitcoin price rose 7.4% in two days but failed to surpass or even retest the $60,000 psychological support level. As a result, BTC is undergoing a reversal to the $56,233 support floor. A breakdown of this barrier will result in a move to the $52,746 to $54,972 demand area.
This down move is crucial to collect liquidity resting under $53,000 – something which is likely to happen this week. If large buyers step in, the downswing will cease, and a reversal can be expected. In a worst-case scenario, however, a breakdown of the $53,000 barrier could lead to an 8.7% crash to $48,379.
BTC/USD 1-day chart
While things are looking down for Bitcoin price, a decisive daily candlestick close above the $60,000 barrier would turn the tables and give hope for an upswing narrative. In such a scenario, BTC could retest the $63,000 resistance barrier.
If the big crypto manages to flip this level, it will likely consolidate between $63,000 and $65,000. Only a daily close above the $65,0000 level would invalidate the bearish thesis.
Ethereum price follows big crypto around
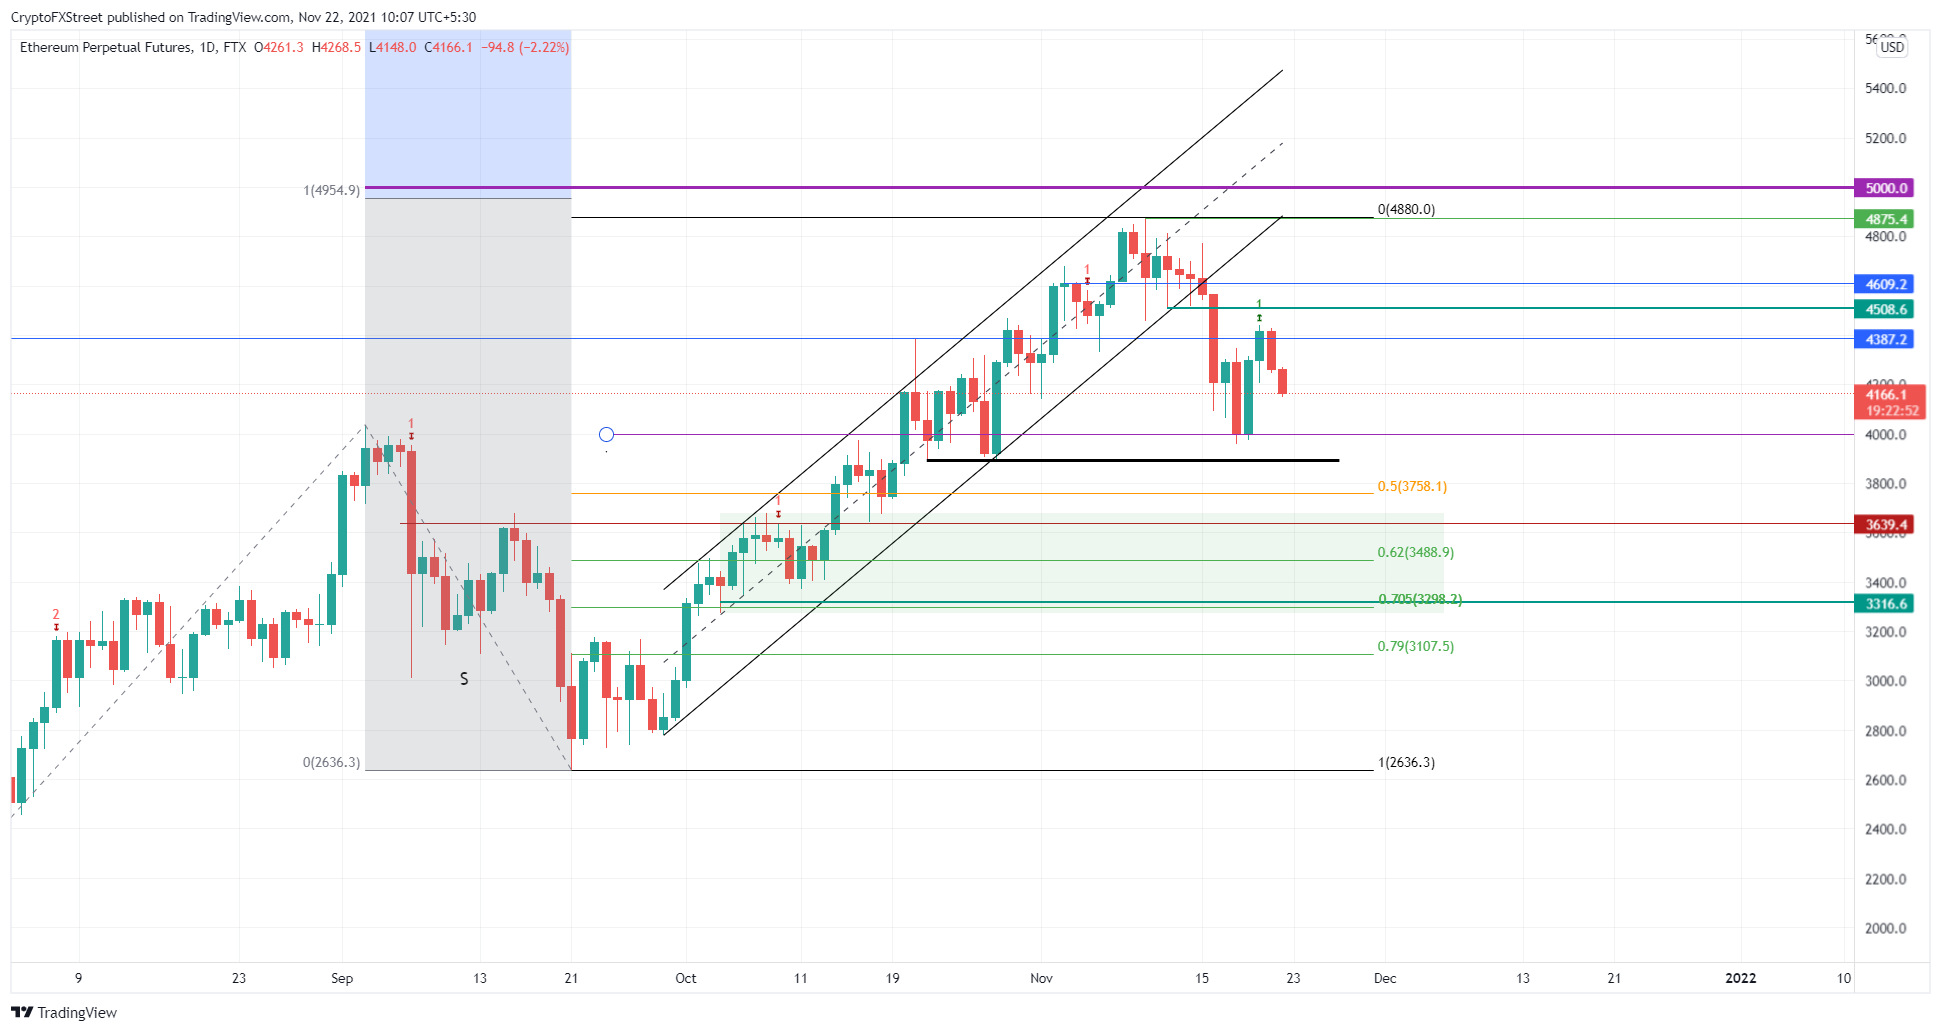
Although Ethereum price was showing considerable strength in its recovery, the retracement in BTC had a knock on effect, causing a strong correction in ETH. As Ethereum price trades around $4,179, investors can expect it to retest the $4,000 psychological level.
This breakdown will lead the smart contract token to the 50% Fibonacci retracement level at $3,756. Market participants can expect a short-term relief bounce or consolidation to occur here. However, if BTC heads down to $53,000 or even $50,000, ETH could easily be pulled down to $3,500 or $3,200.
ETH/USD 1-day chart
Ethereum price correlation to Bitcoin is something investors need to watch out for. A drop in BTC could invalidate a perfectly bullish setup on ETH. If BTC manages to produce a daily close above $63,000, however, Ethereum price has a chance at an upswing.
In this situation, ETH could make a run for the $4,609 resistance level. A daily candlestick close above this hurdle will lead it to the all-time high at $4,875. A higher high above this level would invalidate the bearish thesis.
Ripple price begins its retracement
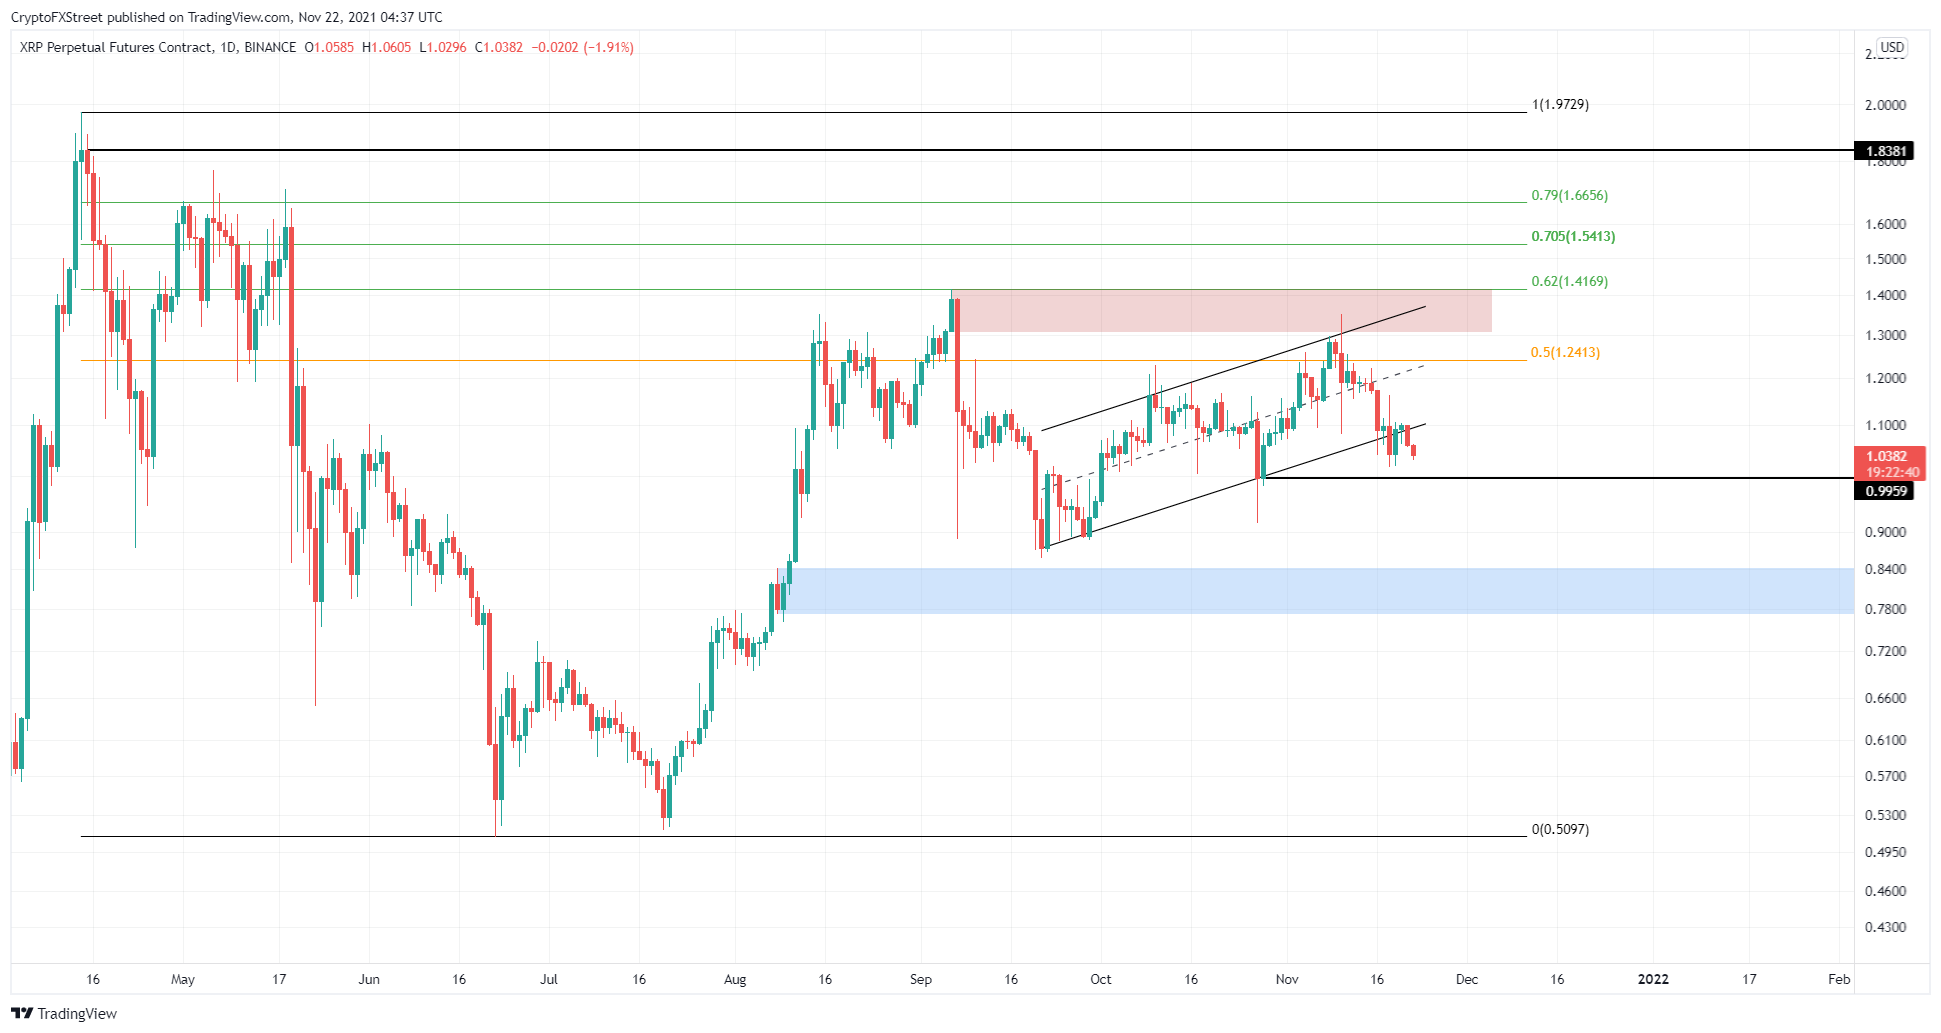
Ripple price set up three higher highs and four higher lows since September 18. Connecting these swing points using trend lines reveals an ascending parallel channel. This setup forecasts a bearish outlook upon a breakout from the lower trend line at $1.09.
On November 18, XRP price breached the technical formation’s base, indicating a breakout. Since then, the minor upswing has confirmed the downswing by retesting the breakout point. Going forward, Ripple price will head toward the $1 psychological level.
A daily close below this barrier will trigger a 15% downswing to the demand zone, ranging from $0.77 to $0.84.
XRP/USD 1-day chart
Regardless of the bearish outlook, if Ripple price manages to stay above the $1 psychological level, there is a chance of a recovery. A daily close above the 50% Fibonacci retracement level at $1.24 will invalidate the bearish thesis.
A flip of the $1.41 level into a support floor, however, will open the path to $1.8 and $2.
Author

Akash Girimath
FXStreet
Akash Girimath is a Mechanical Engineer interested in the chaos of the financial markets. Trying to make sense of this convoluted yet fascinating space, he switched his engineering job to become a crypto reporter and analyst.



