Top 3 Price Prediction for Bitcoin, Ethereum, XRP: Crypto markets look for a floor as risks remain
- Bitcoin price nears completion of anticipated gap-fill between the weekly candlestick and the Tenkan-Sen.
- Ethereum price corrects as Gann's 'Death Cycle,' and overbought Ichimoku conditions weighed on any further upside potential.
- XRP price is overwhelmingly bearish – but the Point and Figure chart shows a massive bear trap could be developing.

As discussed earlier this week, Bitcoin price action has moved to a threshold that will cover the Ichimoku gap that was preventing higher prices. Ethereum price faced the same cyclical and technical warning as Bitcoin and corrected in a likewise manner. XRP price could be positioned for a swift and explosive move higher if certain conditions are met.
Bitcoin price dives 15% for the week; weekend price action could generate even more selling pressure
Bitcoin price began the week with a series of consecutive gaps between the bodies of the weekly candlesticks and the Tenkan-Sen, warning of an impending retracement. Coupled with the Gann' Death Cycle' (forty-nine to fifty-two-day cycle), the movement was anticipated, as discussed earlier this week. However, Bitcoin may not be out of the woods just yet. A deeper retracement to the Kijun-Sen at $49,000 has a high probability of happening over the weekend.
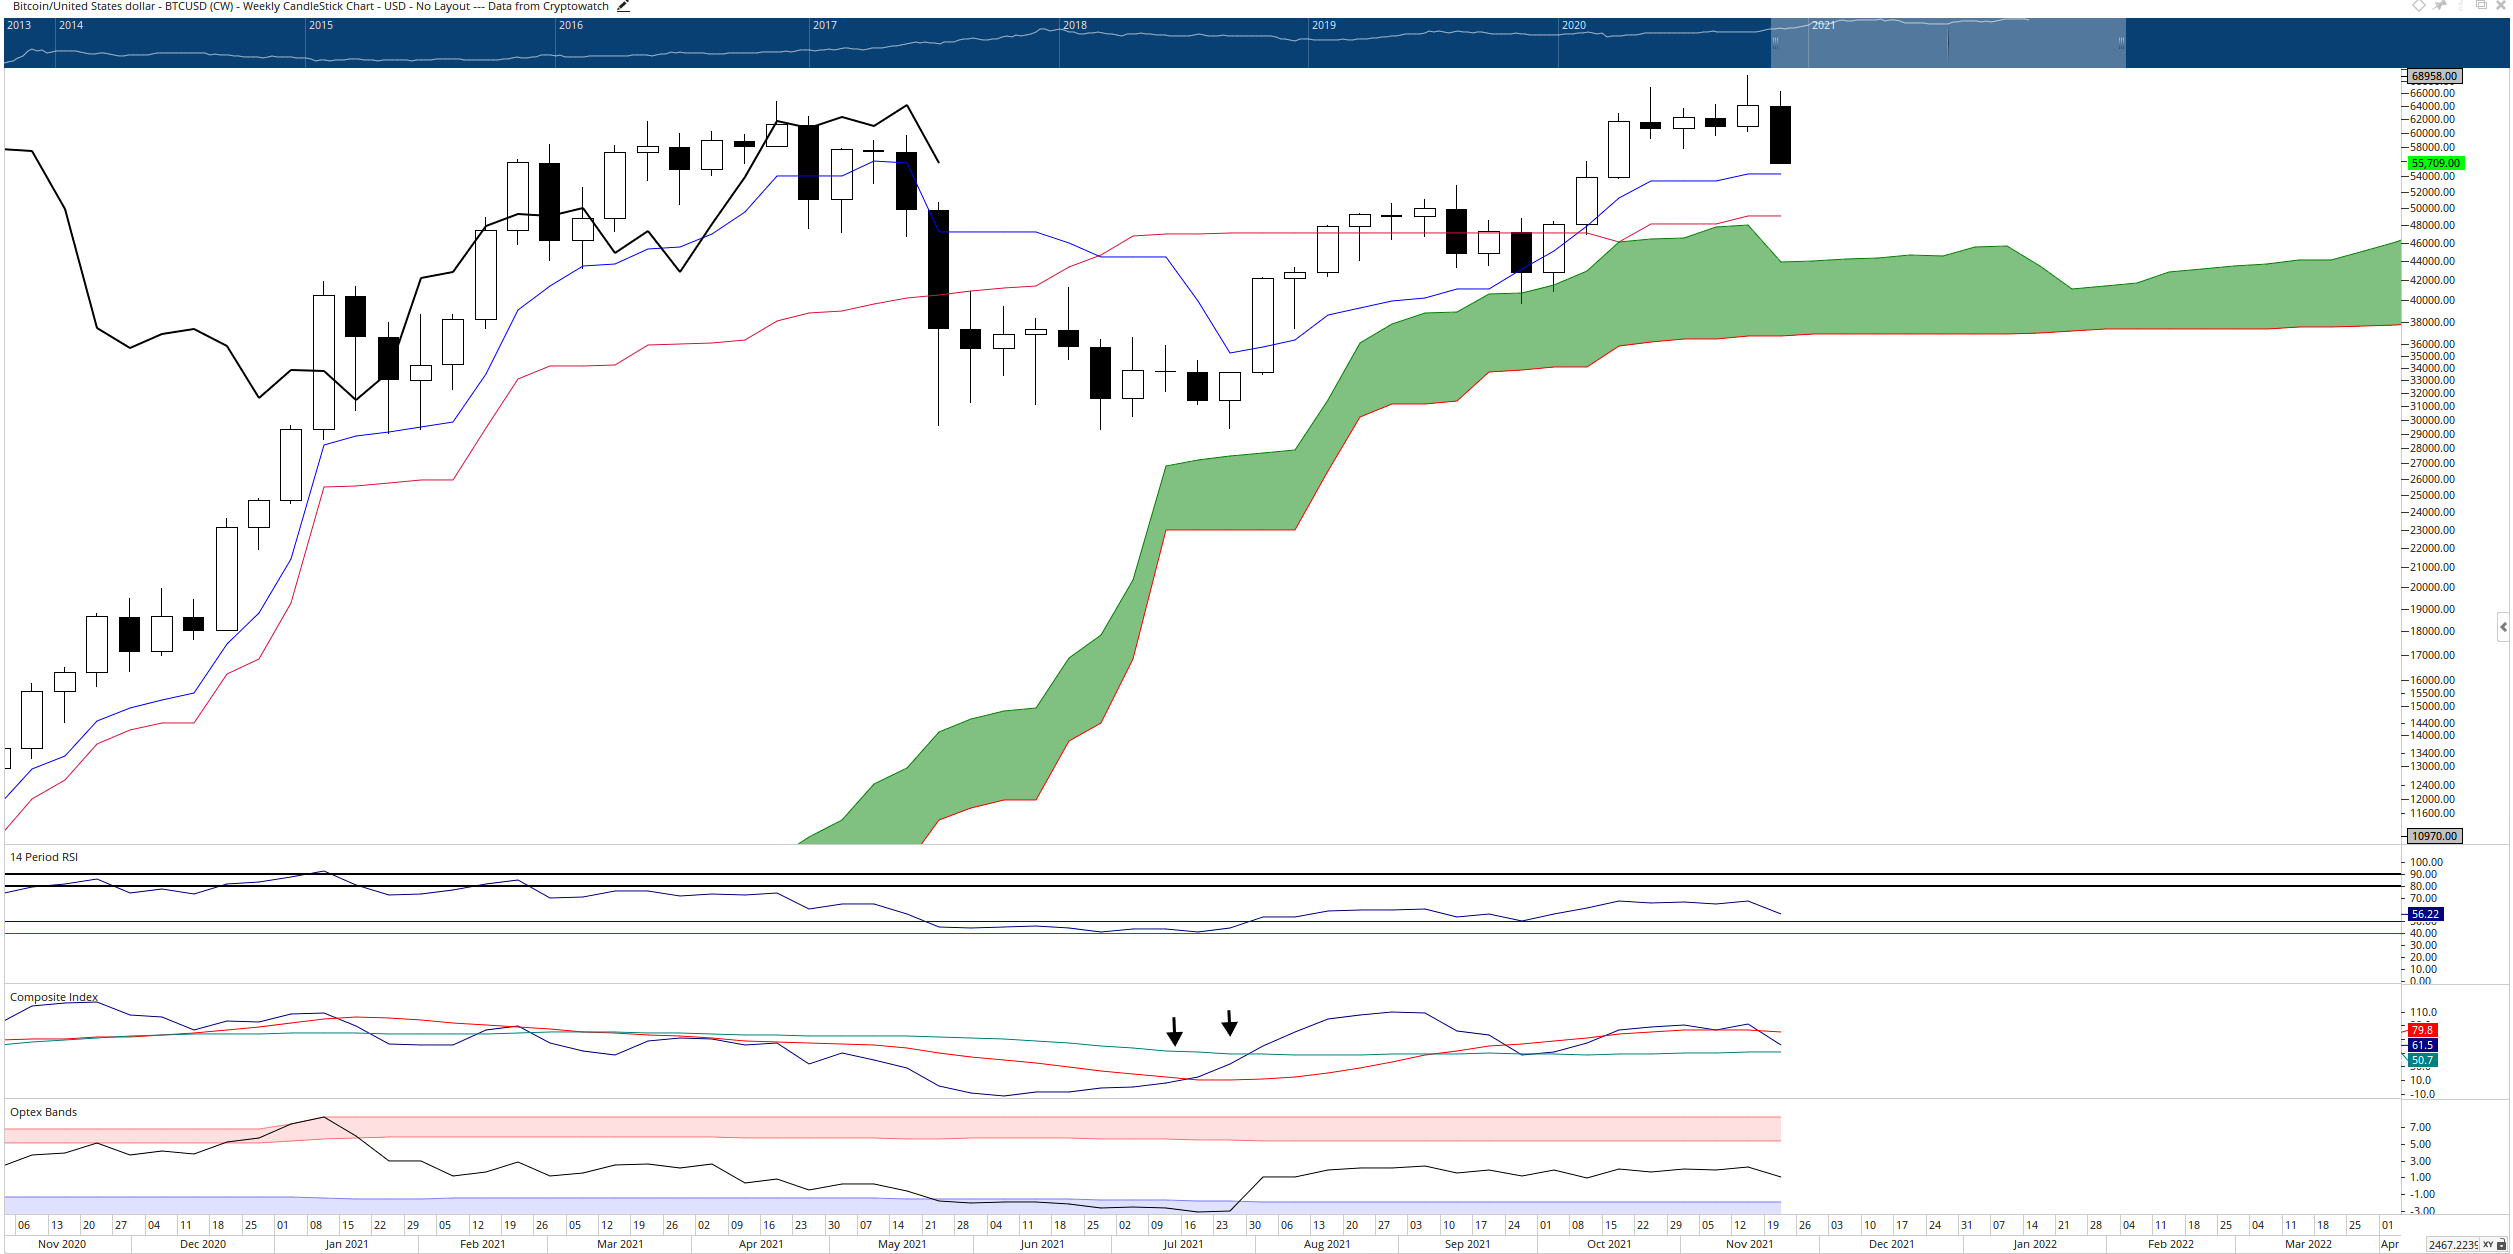
BTC/USD Weekly Ichimoku Chart
Traders will want to pay special attention to Bitcoin price action as it approaches the Tenkan-Sen. With the gap between the candlesticks and the Tenkan-Sen filled, Bitcoin could very quickly begin another leg higher. In addition, the oscillators on the weekly chart support further upside momentum upon support being found.
Ethereum price corrects as Gann and Ichimoku combined to push ETH lower
Ethereum price action is almost identical to Bitcoin's during this week's trading sessions. Like Bitcoin, Ethereum has experienced a substantial 15% move south and looks like it will push even further. A critical level to watch for Ethereum is the pennant formation on the Composite Index. If the weekly Composite Index closes below the lower trend line, that could signal Ethereum capitulating to the $3,300 value area.
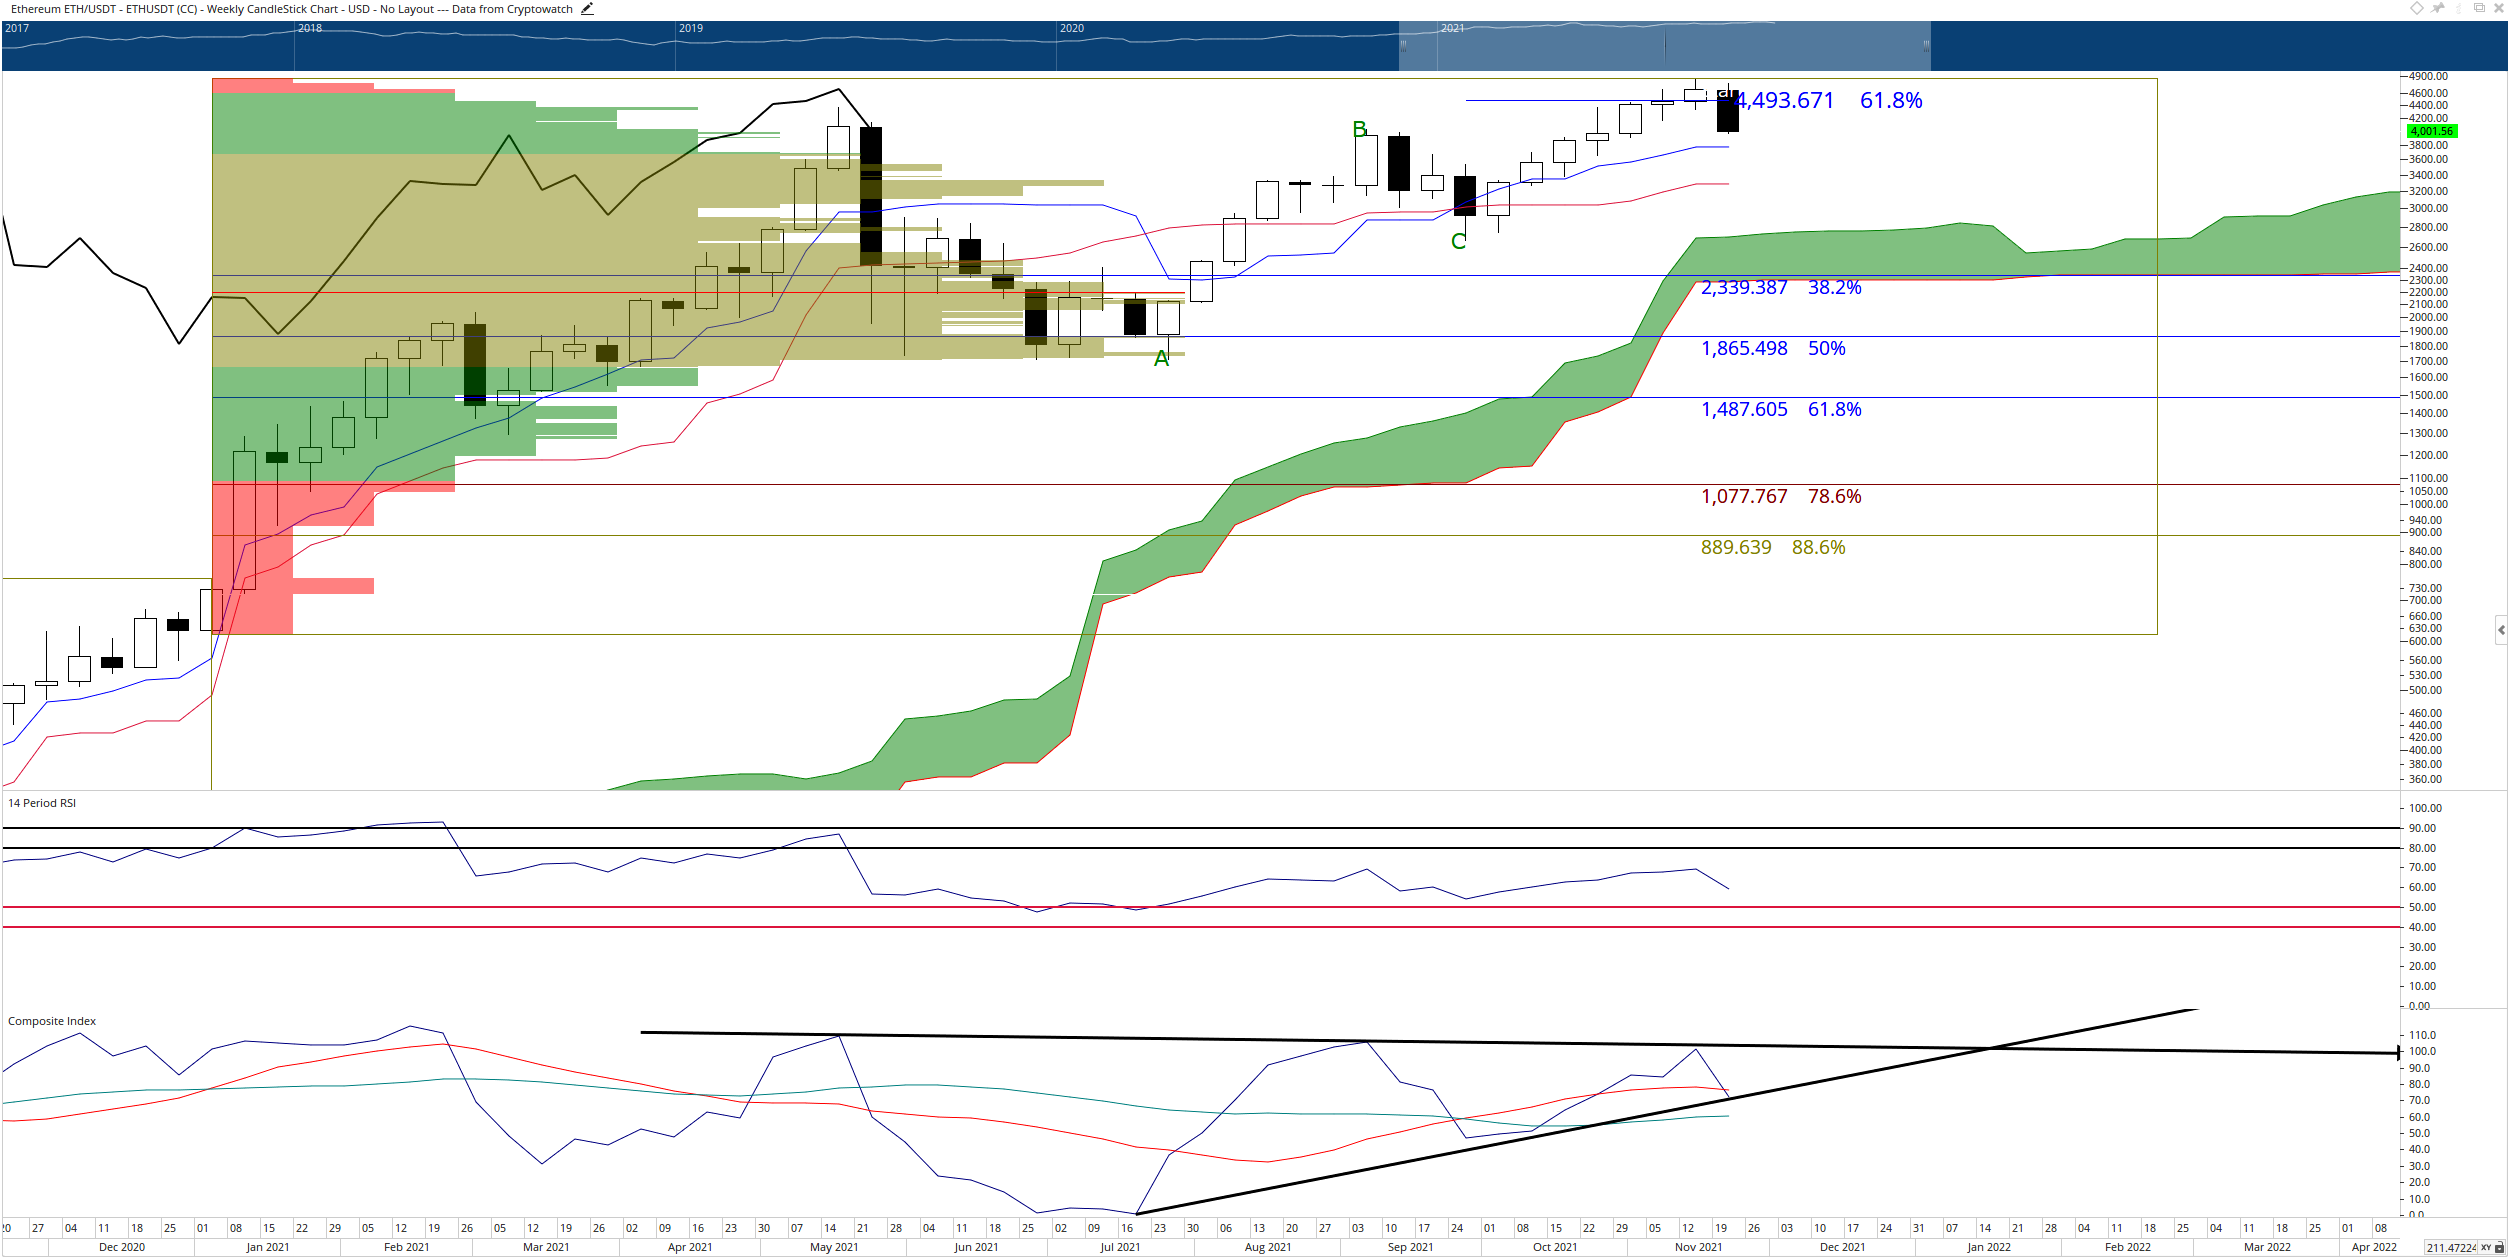
ETH/USD Weekly Ichimoku Chart
However, attention should be given to how Ethereum price reacts on Saturday and Sunday. If there is consolidation above the Tenkan-Sen, Ethereum may take a quick pause before another bullish expansion move begins. A return to the $4,500 value area on Sunday would invalidate any further bearish outlook.
XRP price positioned for a massive bear trap
XRP price has one development that Bitcoin and Ethereum do not: the possibility of a bear trap. And not just any bear trap, but a Point and Figure pattern known as a Bullish Shakeout. The Bullish Shakeout pattern develops when price has dropped two Os below a multiple bottom – in this case, a double-bottom. This highly aggressive pattern can be highly profitable as it often forms the beginning of a prolonged uptrend.
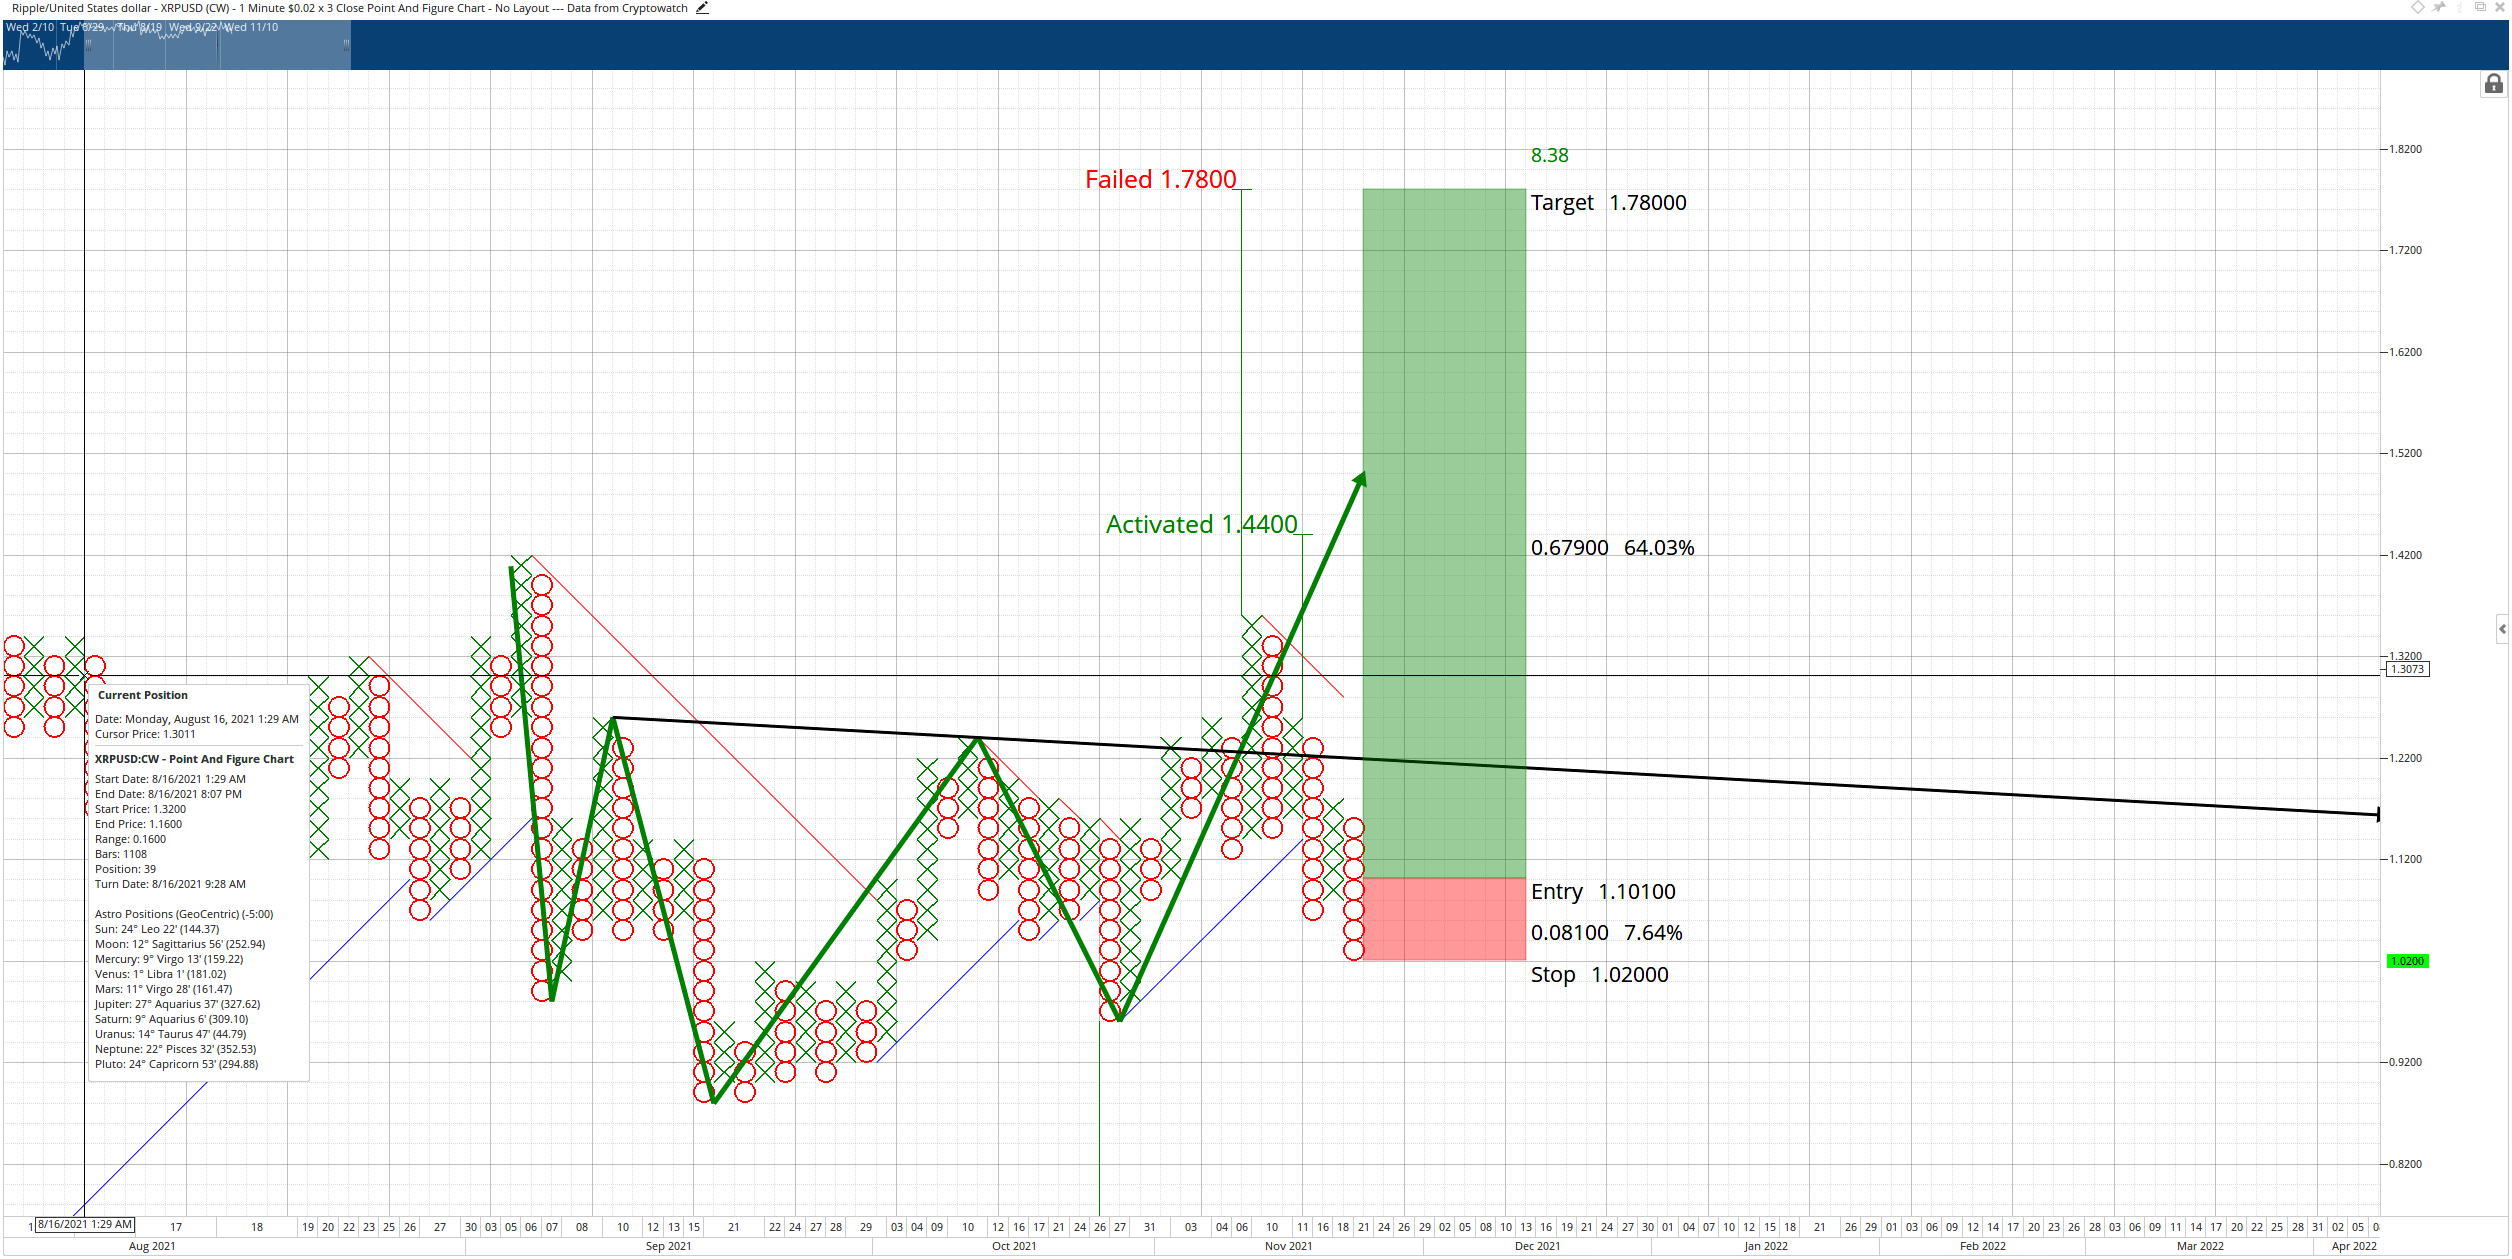
XRP/USDT $0.02/3-box Reversal Point and Figure Chart
The Bullish Shakeout pattern gives a theoretical trade idea – a buy stop order at $1.10, a stop loss at $1.02, and a profit target at $1.78. However, if XRP price drops below 0.98, this pattern is invalidated, and further downside pressure should be expected.
Author

Jonathan Morgan
Independent Analyst
Jonathan has been working as an Independent future, forex, and cryptocurrency trader and analyst for 8 years. He also has been writing for the past 5 years.


