Three altcoins to watch this week: Dogecoin, Crypto.com and Litecoin
- Dogecoin price rallied by 50%, piercing several resistance levels.
- Crypto.com price has printed consecutive bullish divergences on the Relative Strength Index.
- Litecoin price might be days away from another rally.

Despite Bitcoin's bearish price action throughout November, several altcoins have served as profitable trading opportunities. Within the Crypto market, DOGE, LTC and CRO all show potential for more uptrend rallies in the coming days.
Dogecoin price blows past resistance
Dogecoin price has rallied by 50% since November 21 after briefly tagging the $0.07 zone. The ascension took the market by surprise as the bulls were able to conquer several resistance zones.
Dogecoin price currently auctions at $0.094. The broken support that briefly acted as resistance on November 25 was pierced during the weekend, and the bulls produced a surging rally surpassing both the 8-day exponential and 21-day simple moving averages.
The only thing sidelined bulls will need to justify opening a long position will be a classical retest and rally signal from recently breached zones near $0.08. The coiling of the moving averages adds credence to the bullish optimism lingering in the market. The coiling effect is usually witnessed before the bullish cross signal occurs. A bullish cross is when the two signals collide under the auctioning market price. Bullish crosses are known to catalyze strong uptrend rallies.
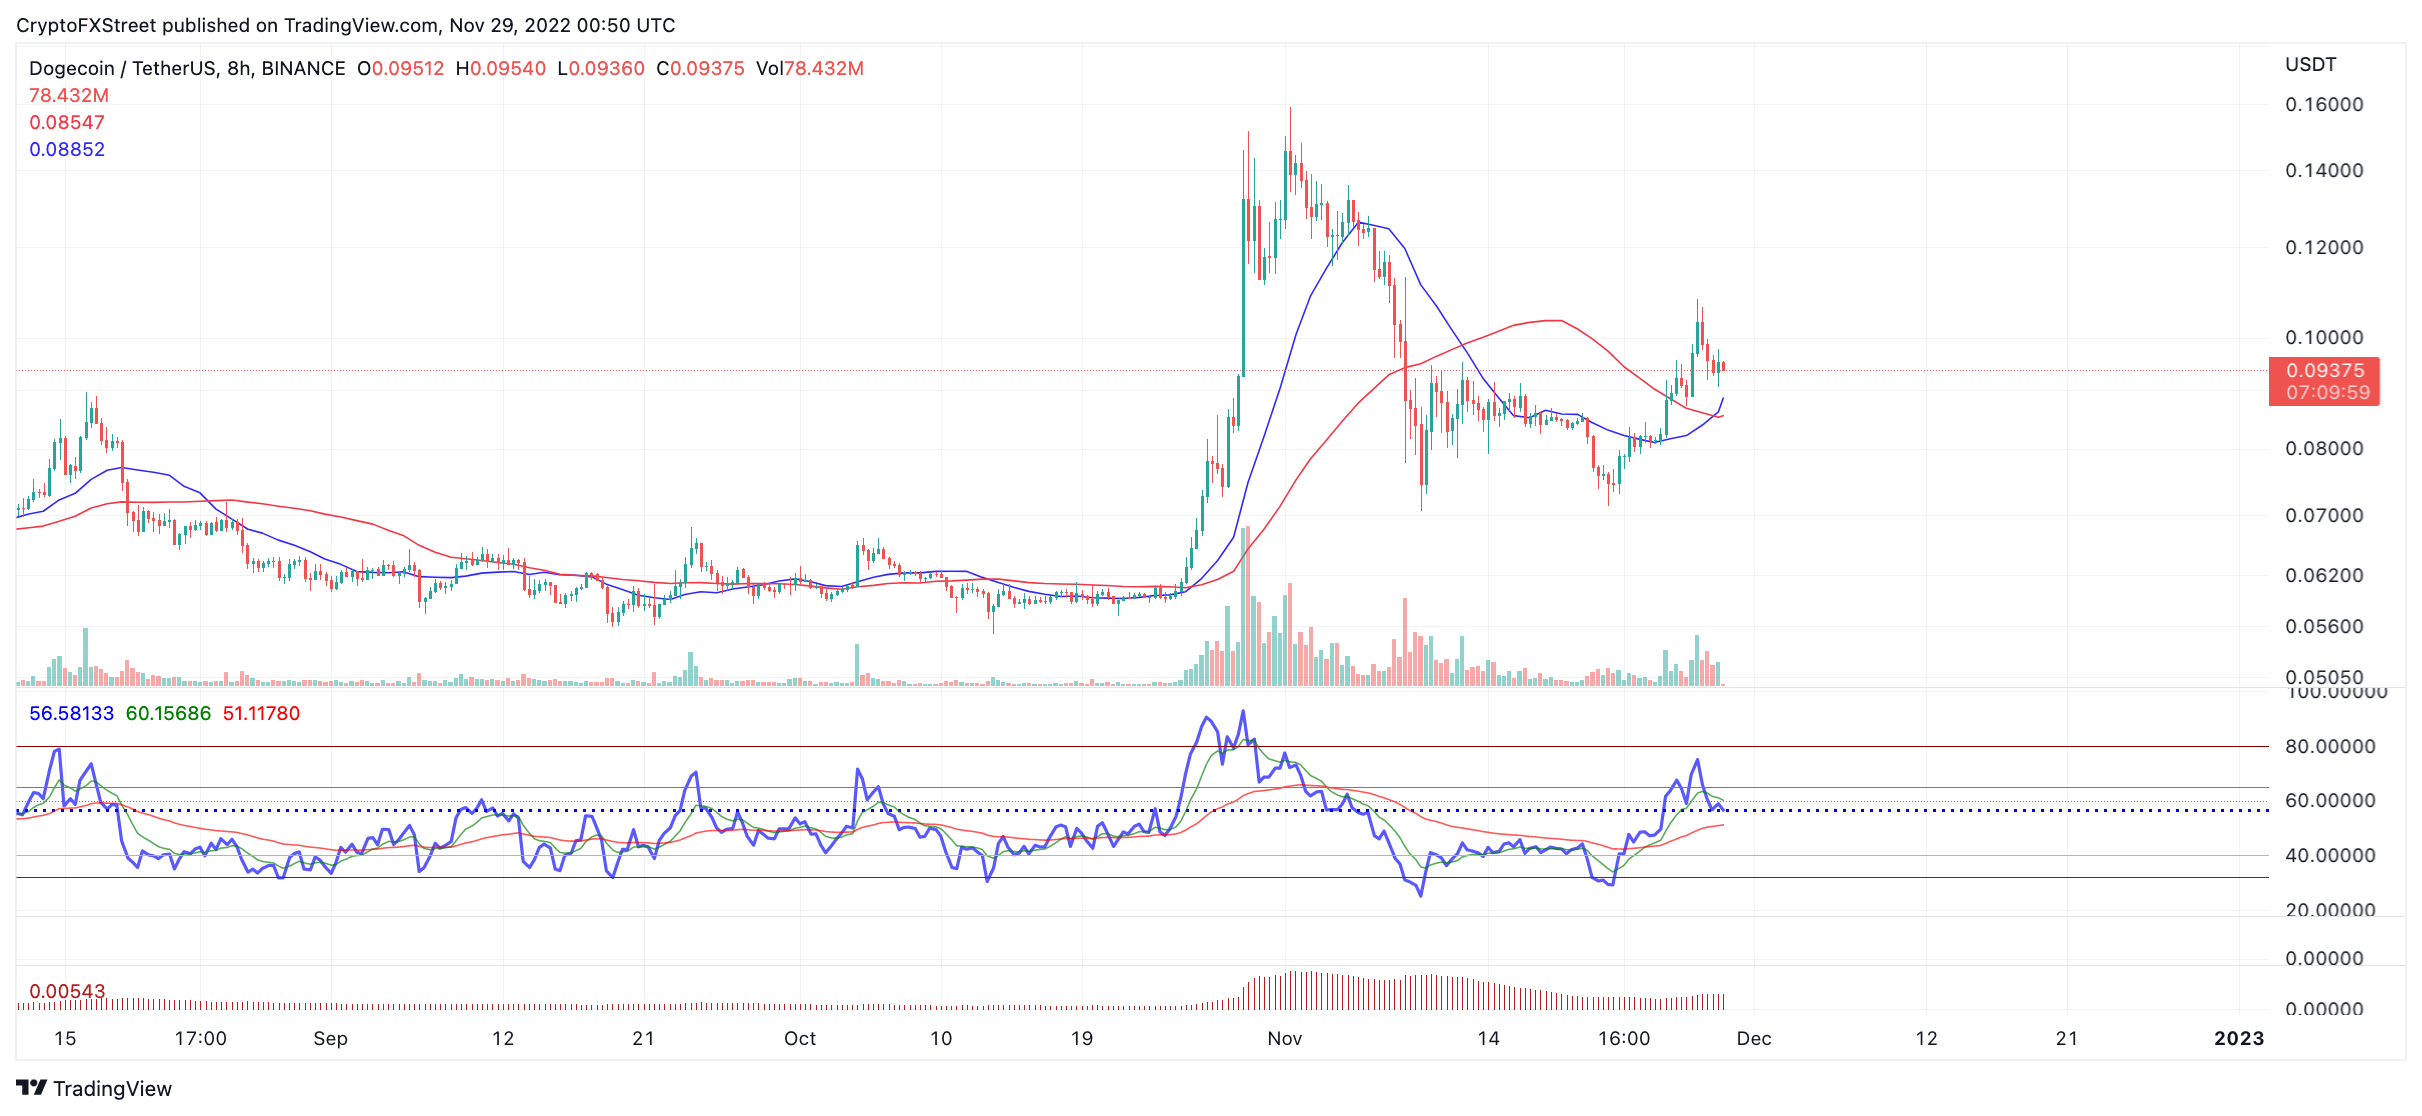
DOGE/USDT 8-Hour Chart
If the market is genuinely bullish, bears placing their stop losses above the November highs near $0.15 will likely face a challenge. The bullish scenario creates the potential for a 65% uptrend rally.
Crypto.com price shows consecutive buy signals
Crypto.com price currently trades at $0.0631, which has produced a vital buy signal that sidelined bulls have been waiting for. Since falling 50% earlier in the month, the CRO price has progressively settled at lower prices in each auction. Specifically on November 13 at $0.066. November 21 at $0.064, and November 28 closed at $0.0633.
Crypto.com price now auctions at $0.0629. The three closing dates produced a bullish divergence on the Relative Strength Index (RSI). The RSI is a tool used to assess the psychology of market participants and their potential impact on an asset's trading price. The divergence between all three dates suggests more bulls are holding on to their positions despite the stair-stepping price action.
Considering CRO's optimistic gestures, there is a high chance for a countertrend bounce.
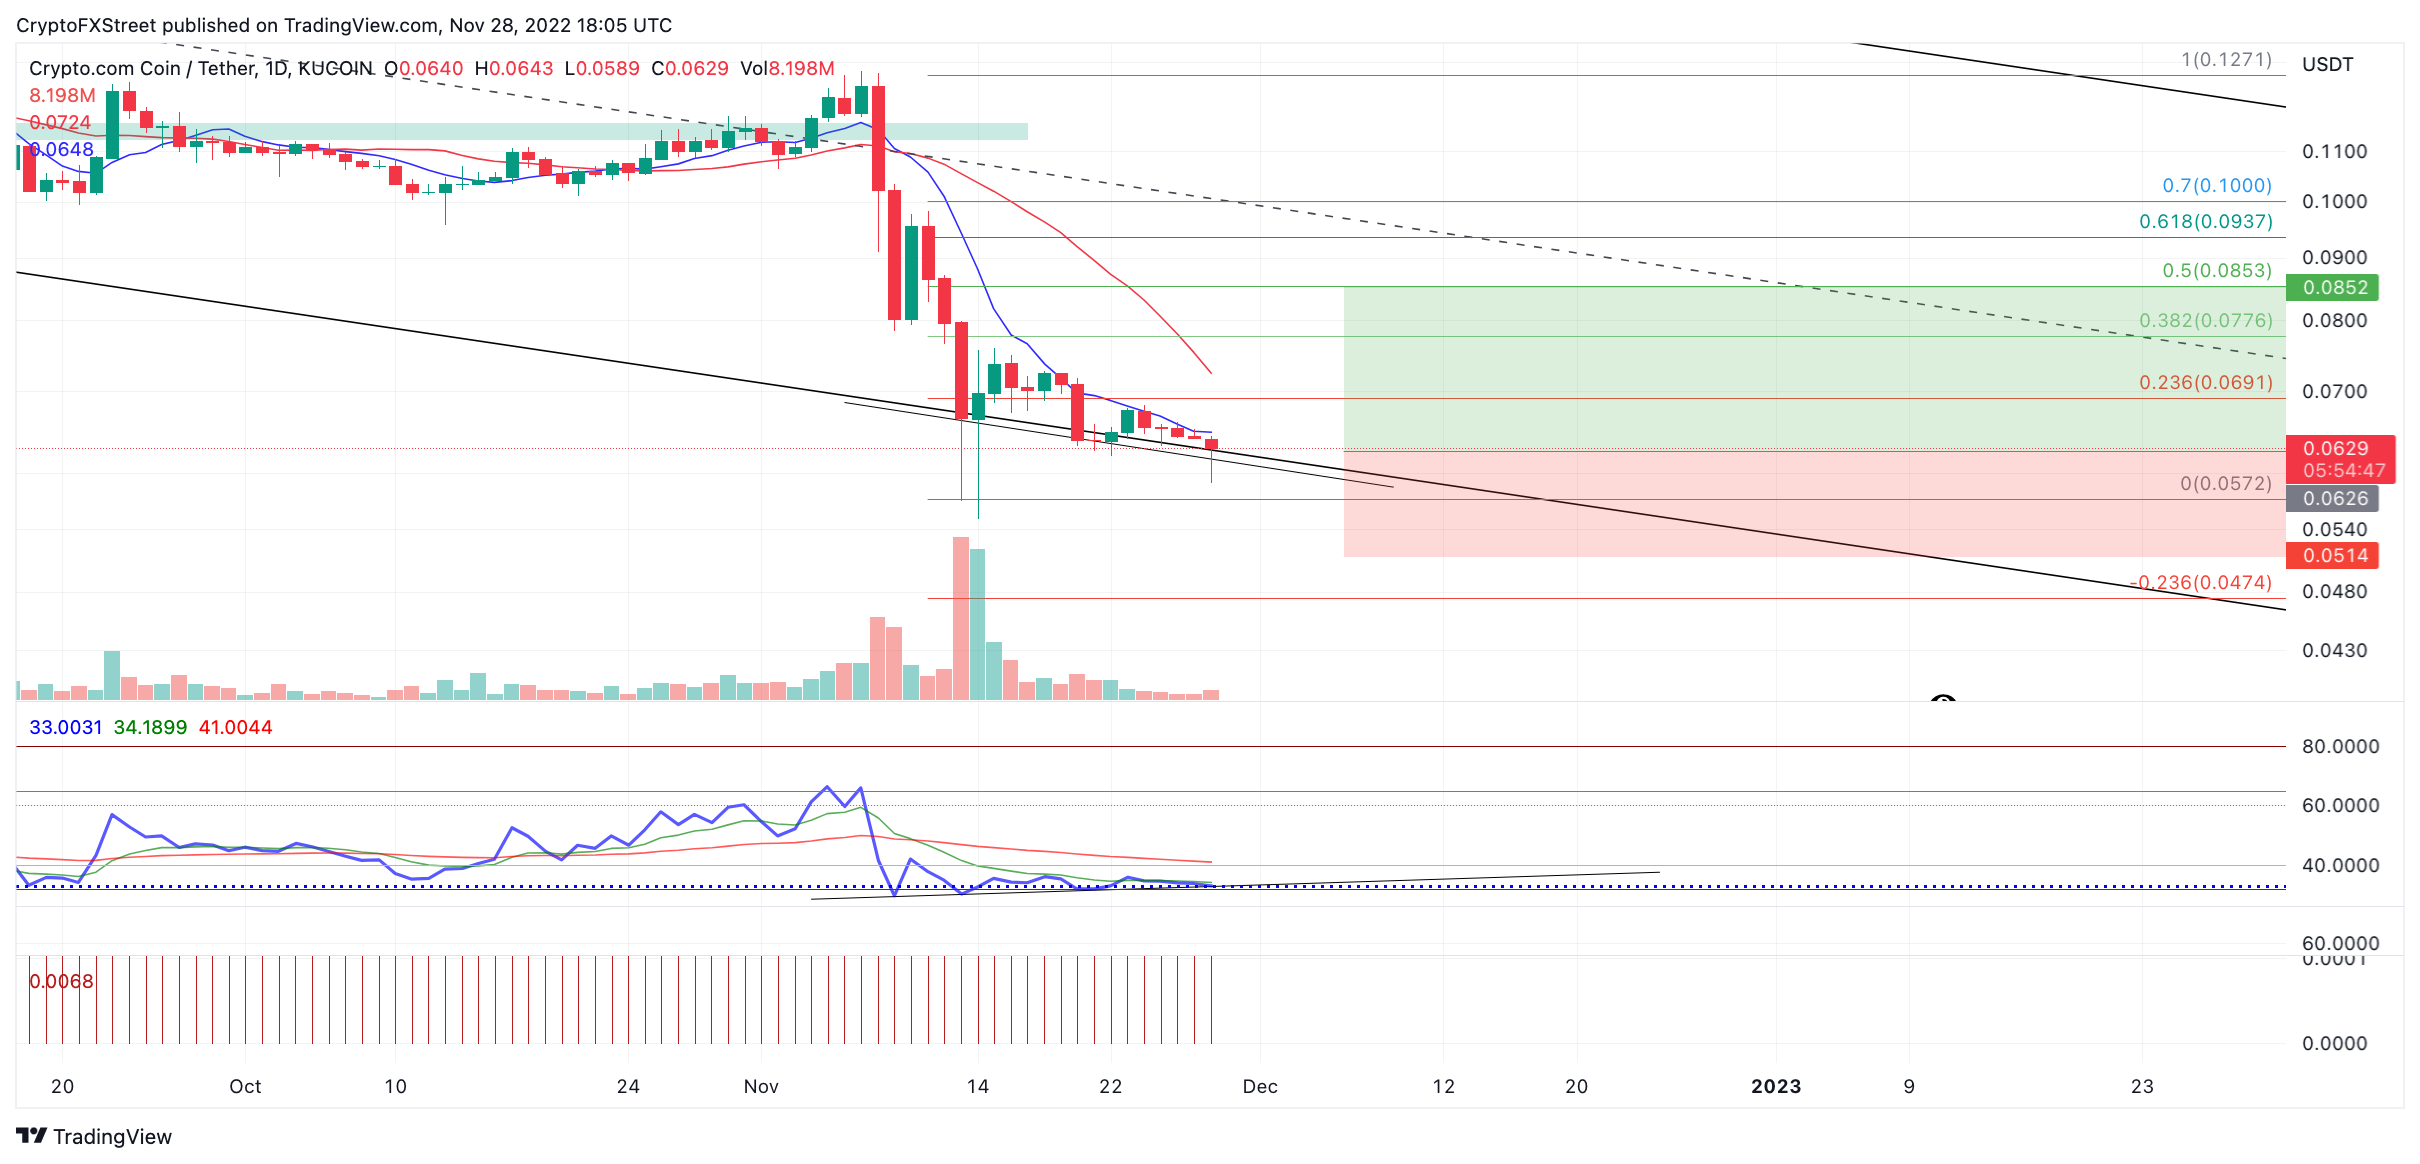
CRO/USDT 1-Day Chart
A Fibonacci retracement tool surrounding the steepest downtrend in November shows key Fibonacci levels at $0.077 and $0.085. The 61.8% Fib level, considered the "Golden Pocket" target zone amongst traders, is positioned at $0.093. A tag of the level would create a 50% uptrend rally from Crypto.com's current auctioning price.
Litecoin price is a must watch
Litecoin price rallied by 75% in November, outperforming nearly all cryptocurrencies. Now, as the final days approach the month approach, LTC price is set to make a bullish statement for the months to come.
Litecoin price auctions at $75 as the bulls are finding support from the 8-day EMA following a week of profit-taking congestion near the $70 zone. The previous congestion, which also retested the 8-day EMA and 21-day SMA before exploding into the monthly high, took only three days of consolidation. Elliott Wave practitioners use a ‘rule of alternation’ to gauge when consolidation may stretch far or thin. The rule is that consolidations should alternate in time by at least two-to-one but can stretch to as much as a four-to-one ratio.
Considering the rule of alternation, the LTC price has another five days of breathing room before a volatile move comes. This thesis proposes that LTC trade range bound and potentially breach a new high into the $80 barrier within the coming days. Still, traders should look for a lower high and higher low sequence of events even if a new high is established. This would create a triangle pattern which is a trading pattern only witnessed in wave four under the Elliott Wave theory.
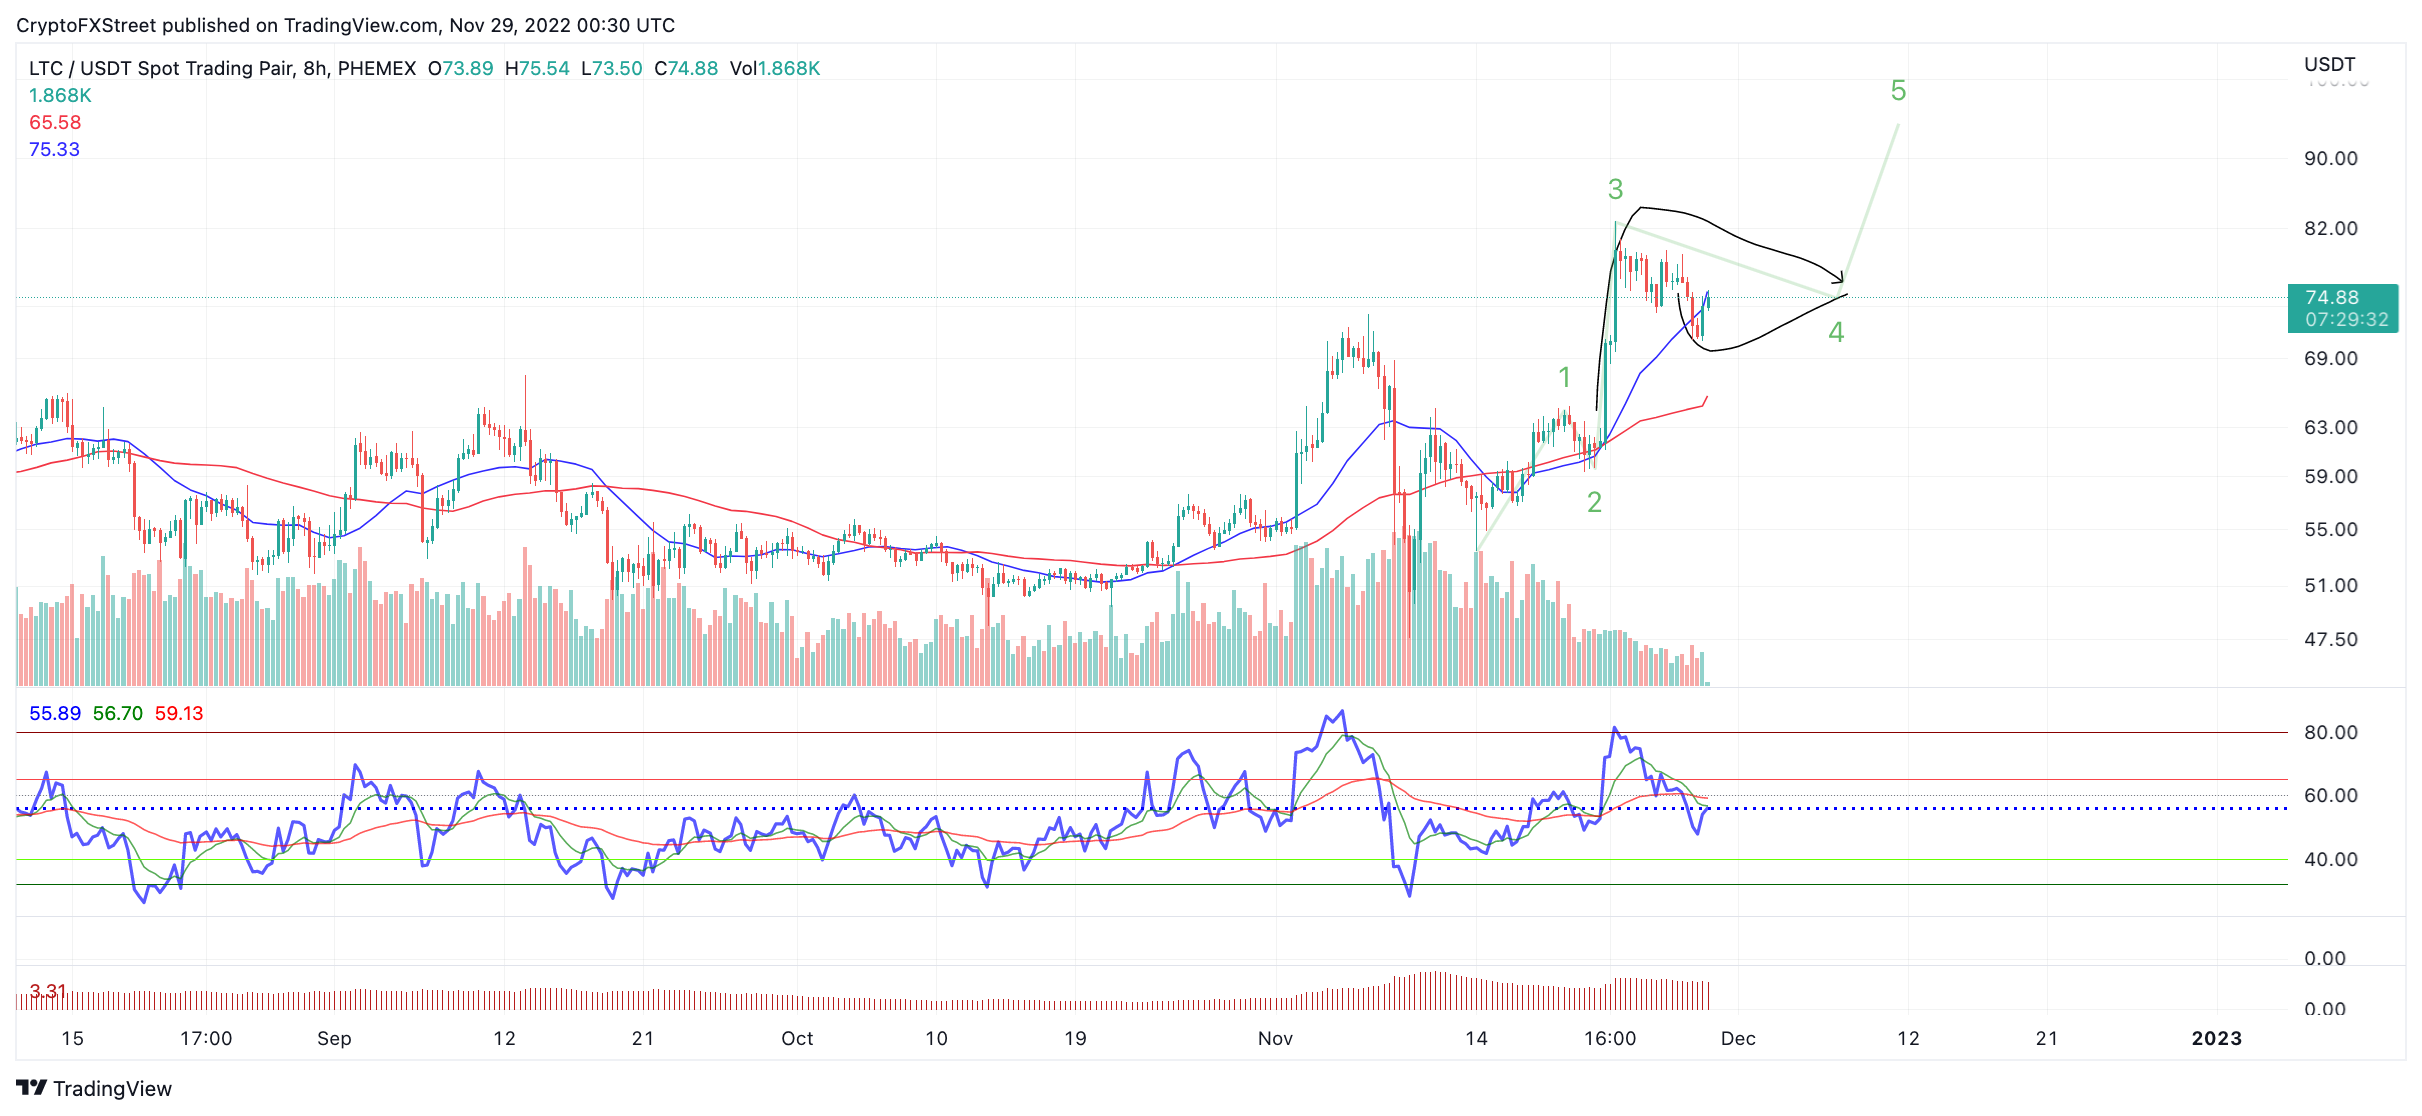
LTC/USDT 8-Hour Chart
For traders looking to participate in an early knife catch scenario, in case the sideways range thesis does not pan out, the uptrend's potential targeting a new LTC high in the $80 zone depends on Wave one at $64.72 remaining unbreached.
Author

Tony M.
FXStreet Contributor
Tony Montpeirous began investing in cryptocurrencies in 2017. His trading style incorporates Elliot Wave, Auction Market Theory, Fibonacci and price action as the cornerstone of his technical analysis.


