Top 3 Price Prediction Bitcoin, Ethereum, Ripple: November's final weekend
- Bitcoin consolidates below a broken level of support.
- Ethereum price recovered 12% of market losses but still shows unsecure signals.
- XRP price diverges from the market and has created a break of market structure.

The crypto market has produced a relief rally that is enticing traders to join the trend and aim for higher targets. Still, going into the final trading weekend, traders should expect volatility and a challenge to make profit. Key levels have been defined to determine the Top 3 crypto's next potential moves.
Bitcoin price in make-or-break
Bitcoin price has recovered 7% of market value after breaking out to the downside after nearly two weeks of consolidation. The newfound low at $15,476 produced a bullish divergence on the Relative Strength Index (RSI), likely enticing traders to consider riding a long position throughout the weekend. Although the BTC price shows optimistic signals, overly-cautious risk management practices should be applied for the remainder of November.
Bitcoin price currently auctions at $16,617. The 7% relief rally has become a stalemate on Thursday, November 24, as the bulls and bears wrestle for grounds on smaller time frames. The 8-day exponential moving average was successfully breached as of November 23, which would give classical price action traders more confidence to aim for the 21-day simple moving average at $17,601.
Still, the Bitcoin price has yet to cross through a triangle apex near the current price levels. The current uptrend move could be considered a circular retest from the recently broken support zone. The Relative Strength Index as a bearish divergence is displayed at the top of the current relief rally.
Based on these factors, holding Bitcoin into the weekend could be problematic. One more low targeting $15,000 stands a fair chance of occurring.
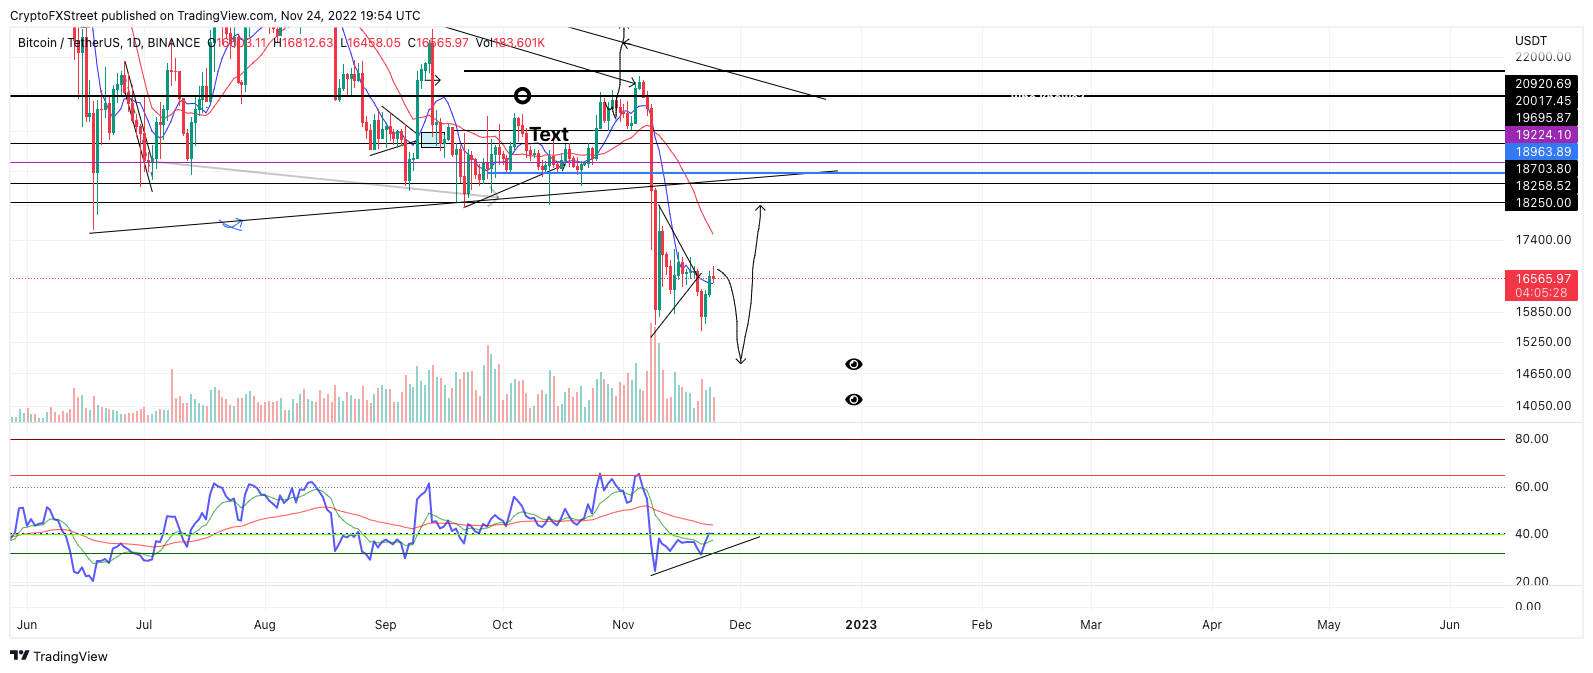
BTC/USDT 1-day chart
Invalidation of the bearish idea is a breach above the swing highs within the previous consolidation at $17,200. If the level is tagged, the bulls could produce a countertrend spike back to the 21-day simple moving average at $17,600. The Bitcoin price would rise by 6% if the invalidation scenario occurs.
Ethereum price retaliates
Ethereum price has pulled off an impressive 12% rally this week as sidelined bulls immediately jumped in a sub-$1,100 price offering earlier in the week. Like BTC, the ETH price has breached the 8-day exponential moving average but remains confined under the previously broken support zone near $1,200.
Ethereum price currently auctions at $1,199. Several bearish divergences have been established on smaller time frames within the recovery rally on the Relative Strength Index. The indicator may be suggesting that the uptrend move will soon be coming to an end. The Volume Profile indicator shows a lack of confidence from all market participants as very little interest is shown compared to the previous sell-off to $1,080 on November 9.
Traders should apply extra caution as the market structure has not yet deemed the recovery rally wave of a larger countertrend rally. Therefore ETH could fall back into sub $1,100 territory. Targets would lie at $1,080 and potentially $1,000.
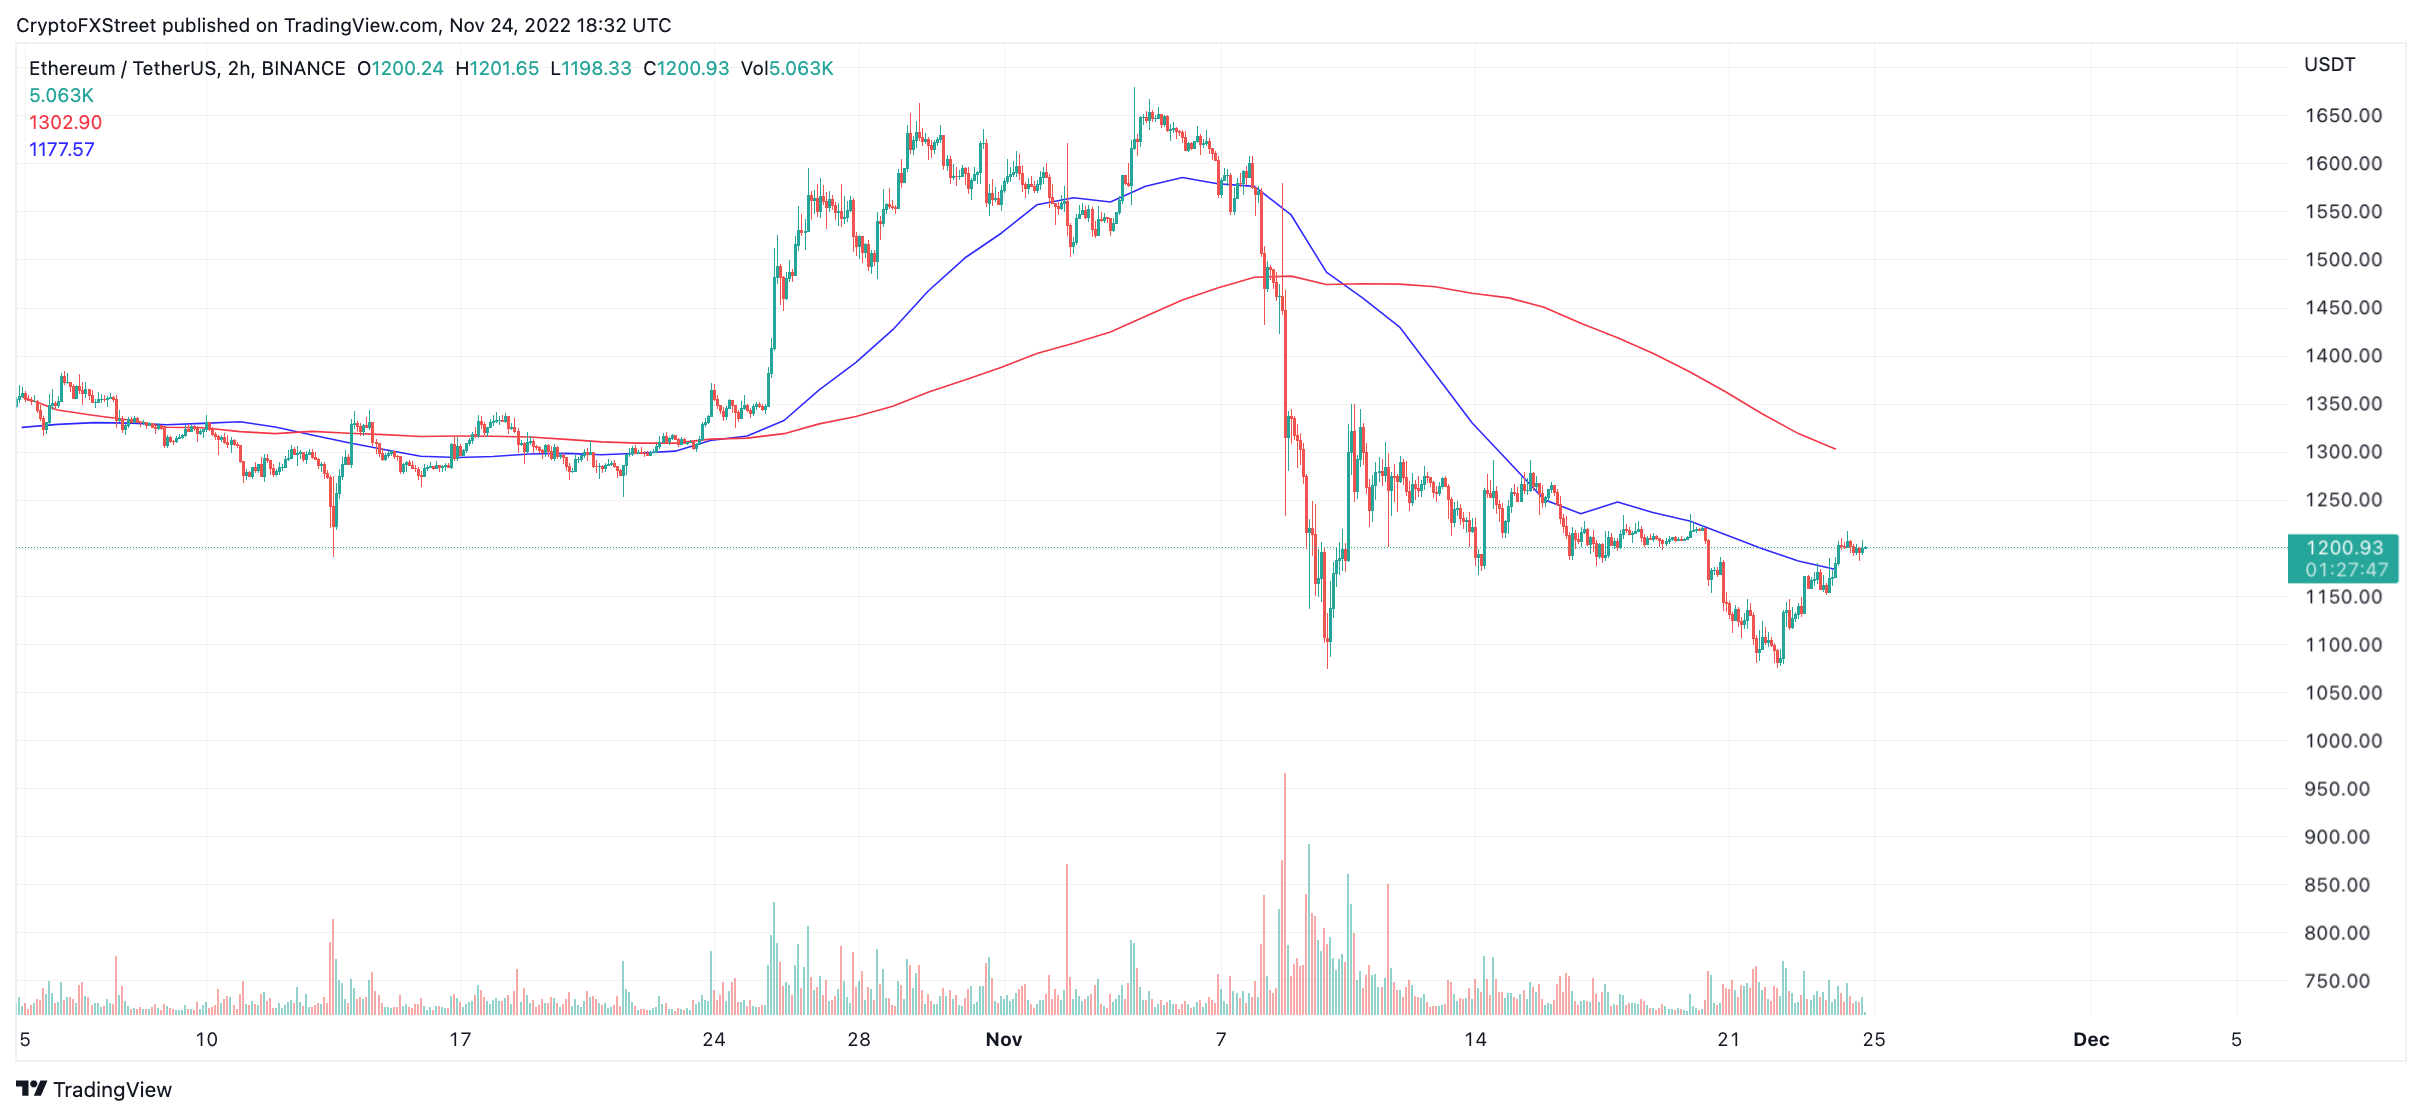
ETH/USDT 2-hour chart
Invalidation of the bearish thesis is a breach above the market structure's swing high at $1,292. If the bulls breach the barrier, an additional rally targeting $1,400 liquidity zone would be a fair target to aim for. Such a move would result in a 16% increase from the current Ethereum price.
XRP price breaks market structure
XRP price has diverged from the pack once again as the technicals display a bullish undertone. Throughout the last two weeks, the digital remittance token formed a range between $0.34 and $0.39, progressively producing higher highs and higher lows. This week, as the bulls have recovered 15% of lost market value, the XRP price has breached the consolidative range to the upside establishing a new high at $0.404.
XRP currently auctions at $0.399. The bullish breach creates a plausible 12% uptrend scenario targeting the previously broken support level at $0.44. The bulls have hurdled the 8-day exponential moving average and are, at the time of writing, trying to hurdle the 21-day simple moving average as well. A close above the second moving average could be the entry signal sidelined bears are looking for to join the trend.
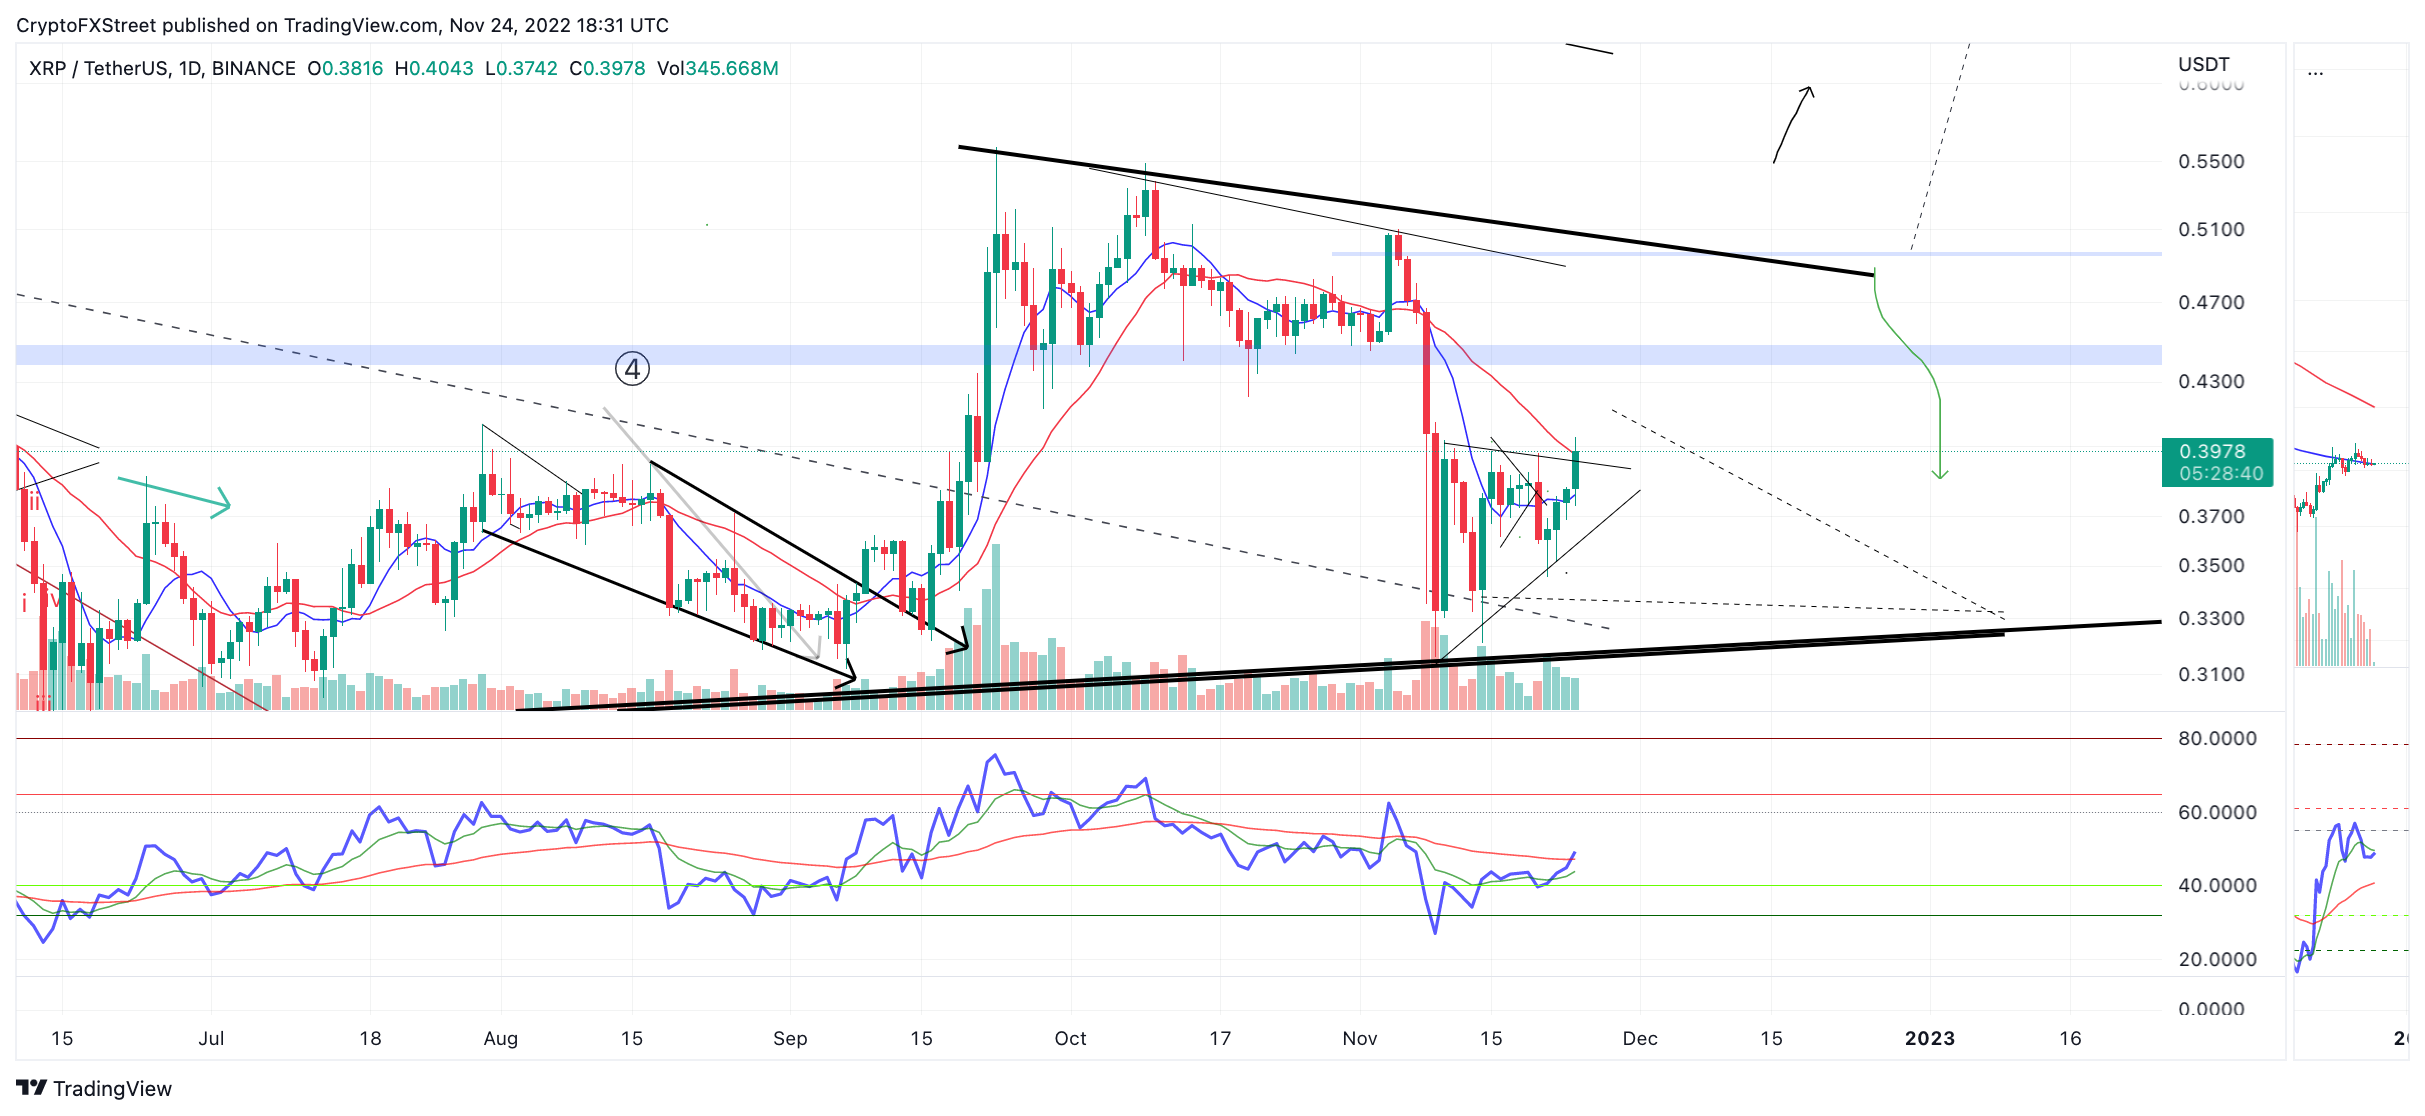
XRP/USDT 12-hour chart
Invalidation of the bullish thesis is a breach below the daily candle that breached the 8-day exponential moving average at $0.367. In that case, a decline toward the lower half of the range near $0.34 and potentially $0.31 could occur. Such a move would result in a 20% decrease from the current XRP price.
Author

Tony M.
FXStreet Contributor
Tony Montpeirous began investing in cryptocurrencies in 2017. His trading style incorporates Elliot Wave, Auction Market Theory, Fibonacci and price action as the cornerstone of his technical analysis.


