What’s next for Polygon’s MATIC price after rallying 90%
- Polygon’s MATIC price has rallied 90% since the June 18 sell-off.
- MATIC price is rising impulsively with an uptick in volume.
- Invalidation of the bullish trend is a breach below $0.316 with contingencies (read below).

Polygon’s MATIC price could make a violent move higher. A bearish move from here will be quite surprising.
MATIC price could get volatile
Polygon’s MATIC price coils just below a triangular barrier that sent the digital asset into the low $0.30 zone during the third week of June. Since the low of $0.316, the bulls have managed to recover 90% of losses, trotting impulsively through the $0.30, $0.40, and $0.50 levels. On Monday, June 27, the MATIC price trades at $0.571 as a profit-taking consolidation ensues after the bulls briefly pierced the $0.60 cent barrier on the 8-hour chart.
MATIC price shows there could be a continuation of the uptrend to end the final week of June. The volume profile index signals an uptick in volume with a tapered effect as the current profit-taking consolidation pattern unfolds. Additionally, the Relative Strength Index has breached oversold territories, justifying the shallow pullback while providing bears a fair chance to close their orders and join the bulls. If the technicals are genuine, a second breach through $0.61 could trigger a bullish spike towards $1 in the coming days.
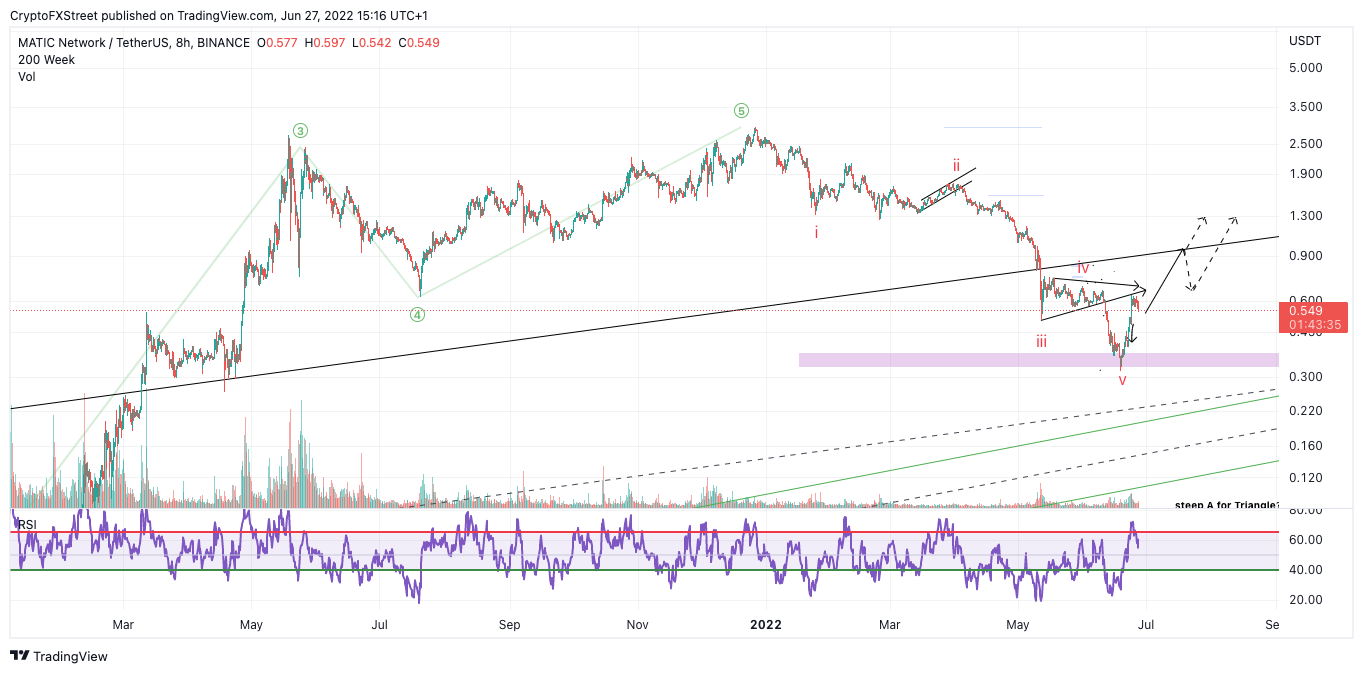
MATIC/USDT 8-Hour Chart
Ultimately, denial could be the catalyst to provoke an additional rally. If shorts are not removed in a timely fashion, a sharp spike through the triangle apex at $0.68 could ensue. An event that could force a highly problematic and volatile bullish environment for bears with less wiggle room to cover.
Invalidation of the bullish downtrend is a breach below $0.316 with one caveat. Traders looking to join the bullish bandwagon should wait for a breach above $0.61 to avoid being sucked into a time-consuming consolidation. It is imperative to remember that a hard stop should be placed below $0.31 as a retest of said price level could induce a seller's frenzy targeting the anticipated $0.20 level, resulting in a 65% decrease from the current MATIC price.
Author

Tony M.
FXStreet Contributor
Tony Montpeirous began investing in cryptocurrencies in 2017. His trading style incorporates Elliot Wave, Auction Market Theory, Fibonacci and price action as the cornerstone of his technical analysis.




