Polygon’s MATIC is due for a massive uptrend unless this happens
- MATIC price bounced above a key Fibonacci retracement level.
- Polygon price could rally towards $1.00 if a second attempt at $0.54 occurs.
- Invalidation of the bullish trend is now a breach below the ascending trend line at at $0.48.

Polygon’s MATIC price continues to display optimistic signals. Being an early bull is justifiable as the invalidation level is clear.
MATIC price is a buy
Polygon’s Matic price could rally towards $1.00 in the coming days. From June 18 to June 24, the bulls accomplished a 90% rally. A pullback occurred, and it was mentioned in the previous thesis that a break below the 61.8% Fibonacci retracement level would be a good signal for bulls to exit the market. On June 30, MATIC price witnessed the anticipated sell-off which printed a low at $0.418, just above the 61.8% Fib. support at $0.411.
MATIC price then printed a higher low above the 50% Fibonacci retracement level at $0.440 on June 30, followed by a 20% rally into the swing high at $0.535 on July 5. Classic price action traders will likely collide a trend line from the June 18 lows at $0.316 into the newly established lows above the Fibonacci levels as a valid indicator of the uptrend's strength. If market conditions are genuinely bullish, an additional retest of the trend line will not be necessary. A second attempt from the bulls to breach the $0.540 level should be the catalyst to induce a bull rally targeting $1.00.
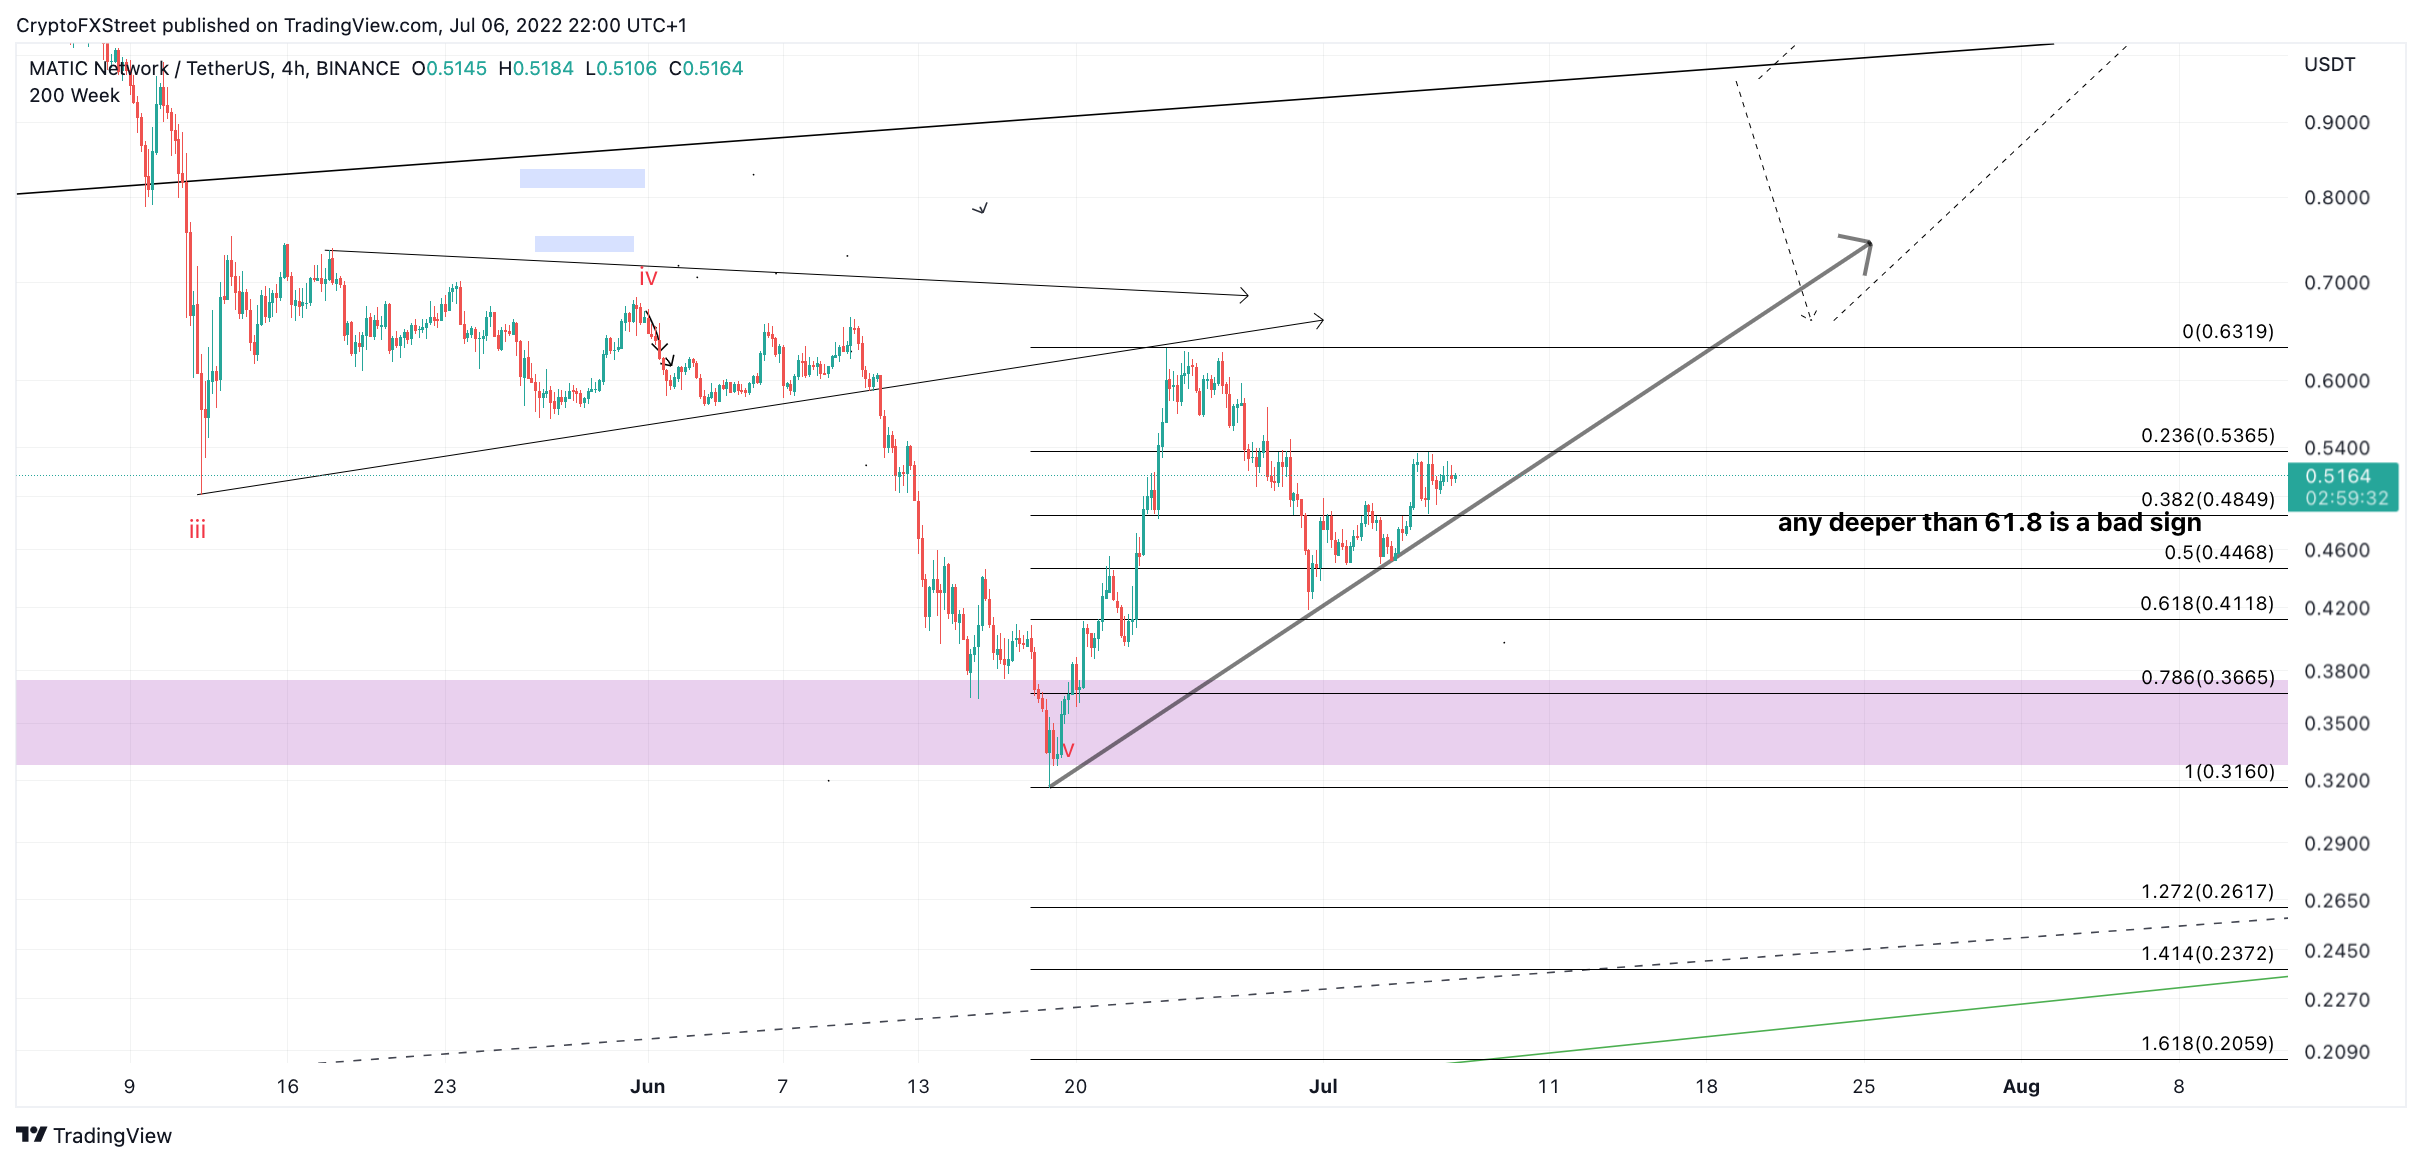
MATIC/USDT 4-Hour Chart
MATIC price currently trades at $0.518. Invalidation of the uptrend is a breach below the newly-established ascending trendline currently positioned at $0.480. However, if the bears can breach this level, expect a second decline to $0.360, resulting in a 30% decrease from the current MATIC price.
Author

Tony M.
FXStreet Contributor
Tony Montpeirous began investing in cryptocurrencies in 2017. His trading style incorporates Elliot Wave, Auction Market Theory, Fibonacci and price action as the cornerstone of his technical analysis.



