This MATIC price deviation provides an opportunity to accumulate before a 40% rally
- MATIC price consolidation deviated below the equal lows at $0.758 on September 19, signaling the sell-stop liquidity run.
- A recovery above $0.758 could trigger a 40% rally to sweep the range high at $1.055.
- A daily candlestick close below $0.758 that flips the range low into a resistance level will invalidate the bullish outlook.

MATIC price saw a spike in selling pressure over the last 48 hours that breached its range, tightening to the downside. As a result, Polygon collected the sell-stop liquidity resting below equal lows.
If the ongoing price action manages to recover above a crucial support level, it could kick-start a run-up.
MATIC price ready to swing higher
MATIC price extended its 28% crash witnessed between August 14 and August 20 to collect the sell-stop liquidity resting below the equal lows at $0.758. This development has punished eager bulls and will likely recover above the range low at $0.758 and produce a daily candlestick close above it.
This development will signal a buying opportunity and will likely kick-start a run-up. The first level Polygon bulls will target is the midpoint of the range at $0.906, which is 21% away. However, a flip of this barrier into a support floor will open the path to retest the range high at $1.055.
This move would constitute a 40% gain. Since this level coincides with a high timeframe resistance level, investors can expect a local top to form here.
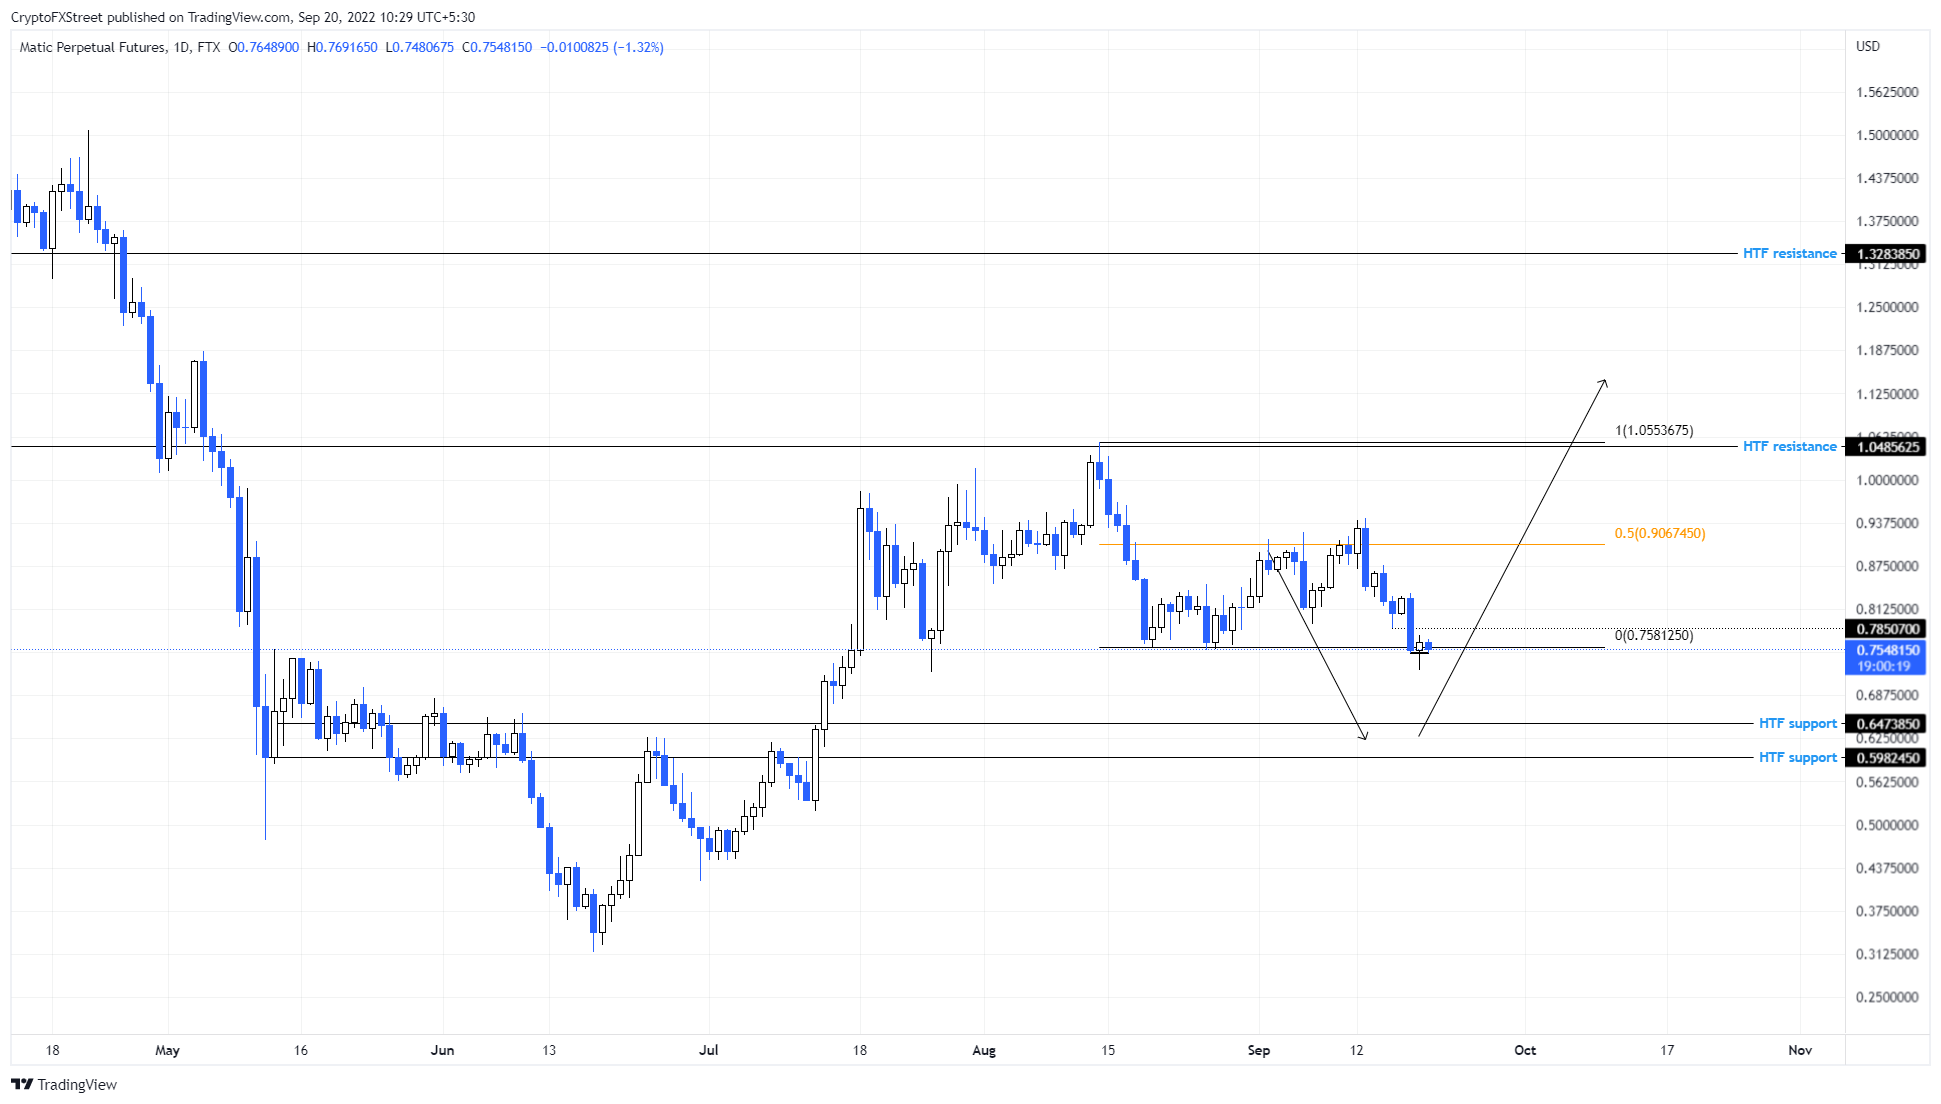
MATIC/USDT 1-day chart
While things are looking up for MATIC price, investors should note that a recovery above $0.758 is required for a bullish move to occur. However, if MATIC price produces a daily candlestick close below the range low at $0.758 and flips it into a resistance level, it will signal a lack of buying pressure and invalidate the bullish outlook.
In such a case, MATIC price could crash to the $0.647 support level to re-evaluate its next move.
Note:
The video attached below explains how the Bitcoin price could influence MATIC price movements.
Author

Akash Girimath
FXStreet
Akash Girimath is a Mechanical Engineer interested in the chaos of the financial markets. Trying to make sense of this convoluted yet fascinating space, he switched his engineering job to become a crypto reporter and analyst.


