This is what Polkadot price needs to reach $26
- Polkadot price is still hovering over a significant trend line.
- DOT price has not displayed strong volume change as yet.
- Invalidation of the bearish thesis is a break at $19.45.

Polkadot price is still bearish neutral. Traders and DOT enthusiasts should consider trading other assets while waiting for more chart patterns to unfold.
Polkadot price is not the best chart to trade
Polkadot price, like several cryptocurrencies, is having a nice uptrend rally to start this week's trading session. However, the Polkadot price is still more in the neutral bearish bias amongst professional traders. For one, the DOT price experienced massive selloffs earlier this month. The bulls have yet to display a daily rally to compete with the size of the multiple 11% sell-offs that occurred.
DOT price also fell below the buyers' territory on the two day-chart before coming back within the range. Meanwhile, the RSI pattern is signaling overall bearish control, which could cap the counter-trend power of the bulls. Polkadot price still hovers around the wave Y trendline, which is optimistic. Polkadot bulls have not displayed any bullish momentum post-landing.
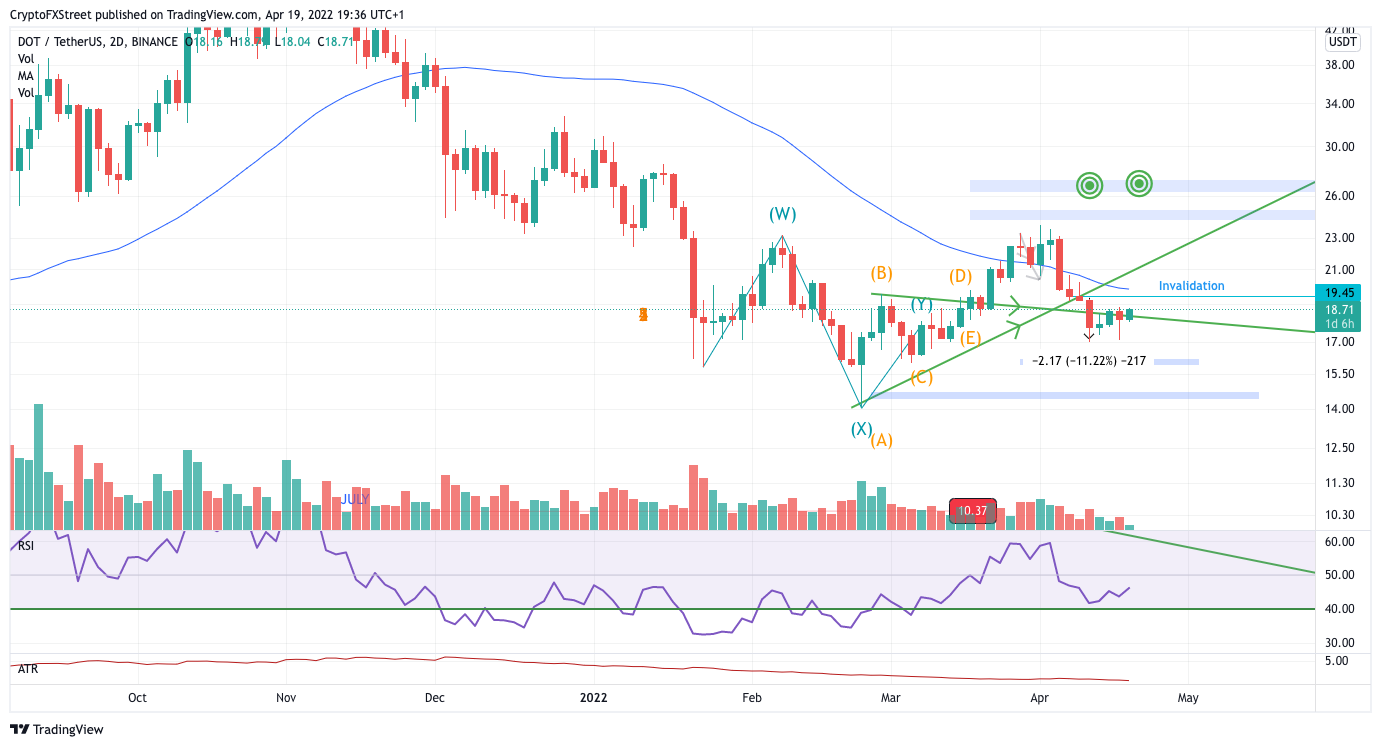
DOT/USDT-2-Day Chart
Hence, traders should consider other cryptocurrencies to have stronger potential rallies in the coming days. Polkadot price needs to develop more evidence to create future bullish bias. An ideal setup for DOT price will be a breach at the $19.45 level.
The overall bearish scenario will be invalid if the Polkadot price can create a rally to $19.45. DOT price would ideally continue higher, followed by a pullback. Traders could then look for an entry to rally 40% towards the March target of $26.
Author
FXStreet Team
FXStreet
Composed of a group of economic journalists and FX experts, the FXStreet content team produces and oversees all content published on FXStreet. It provides a purely journalistic approach to the Forex market.


