Polkadot price could be about to reverse, but bulls remain cautious
- Polkadot price hints at a bullish takeover on the 2-week chart.
- Still, there is potential for DOT to drop another 12% before forming a market bottom.
- It is worth noting that a 2-week close below $15 can invalidate the bullish thesis.

Polkadot price has been in a downtrend for several months following the new all-time high of $54 in October 2021. Despite the bearish sentiment, multiple indicators hint that a bottom for DOT could be near.
Polkadot price may finally turn around
Polkadot price has rather convincing evidence of smart-money involvement, especially on the higher timeframes where large investors tend to operate. Indeed, DOT's 2-week chart shows the potential to be a great indicator to forecast buying opportunities in the future.
The 2-week Relative Strength Index is currently hovering around the 44 level, only four integers away from the infamous 40 level. For Polkadot price to fall into the 40-zone, bears would have to push it down by 12% from current price towards $15.
Moreover, the RSI is displaying bullish divergence. The lows printed on July 21, 2021, at $10.37, are higher on the RSI than the lows printed for the last four weeks at $16.5.
The Bollinger Bands is another clear indicator of smart-money involvement on the 2-week chart. Due to Polkadot price action, the lower band dropped to the downside over the past few trading sections. Such market behavior usually precedes a bullish price action.
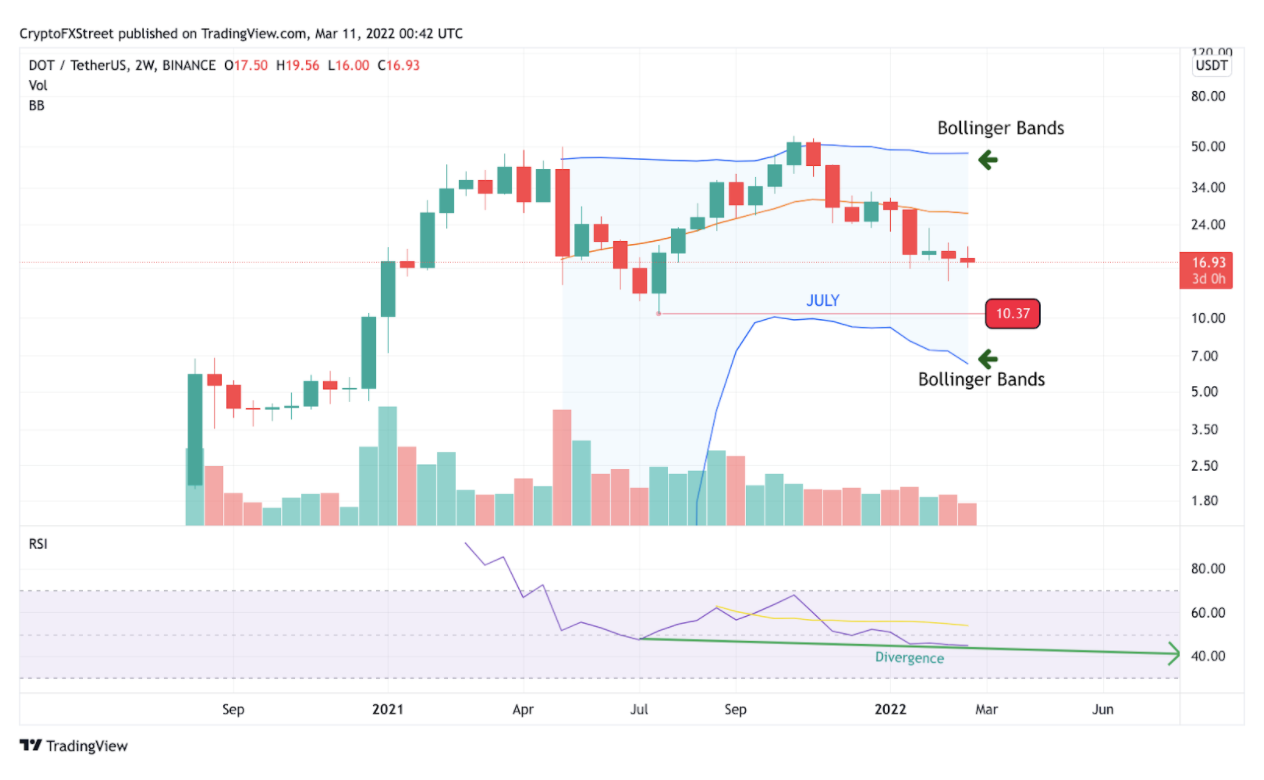
DOT/USDT 2-week chart
Finding an entry will be a true challenge for Polkadot enthusiasts as a sell-off is likely to be absorbed fast by savvy investors. If bears can print a close below $15 on the 2-week chart, the RSI will fall out of buying territory and entirely invalidate the bullish idea.
If this happens, bears will likely try to push Polkadot price towards July's lows at $12 and or even $10.37, which would be roughly 40% below the current levels.
Author
FXStreet Team
FXStreet
Composed of a group of economic journalists and FX experts, the FXStreet content team produces and oversees all content published on FXStreet. It provides a purely journalistic approach to the Forex market.


