Polkadot price to benefit patient traders with a triangle breakout
- Polkadot price is forming a complex correction.
- DOT has made impulsive rallies in both directions.
- Traders should wait for more confirmation before forecasting future trend's direction.

Polkadot price looks to be coiling into a triangle formation currently unfolding as a Y wave within a larger WXY correction. This consolidation is squeezing the DOT price under low volatility, which is valid for a no-trade zone until further confirmation is displayed.
Polkadot price squeezes into consolidation mode
Polkadot price has been one of the more challenging assets to keep track of this year. From January 26 to February 6, a 46% bull run took place. Shortly after, a 65% correction took place as the bulls capitulated to a low of $14.
Elliot Wave analysis suggests that directional trends are typically started by impulse moves where waves one, three and five go with the trend, while two and four go against it. Another critical rule for wave theory is that the fourth wave cannot overlap into the territory of the first with one exception being a leading diagonal.
On the four-day chart, Elliott Wave analysts could argue that the bull rally that took place was either impulsive or a leading diagonal depending on what time frame was used. What makes analyzing the Polkadot price more challenging, is that the downside correction invalidates the bull run's impulse by taking out the low. It's also worth noting that the 65% sell off also unfolded in five clean waves as well.
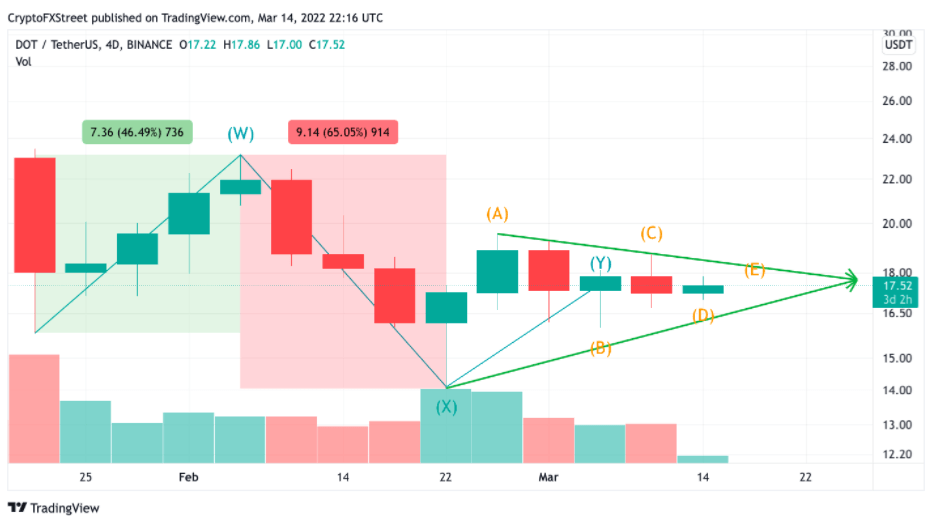
DOT/USDT 4-Day Chart
Because one can qualify either of the previous trends as impulsive waves, the most likely explanation for Polkadot price is that the digital asset is likely forming a larger complex WXY correction.
Jumping down to the 9-hour chart gives further validation for this idea. For one, the 9-hour chart depicts the W wave as impulsive, where the fourth wave barely progressed forward without overlapping the first wave. Secondly, the current unfolding Y pattern is also coiling in a three-wave swing-like manner, typical for triangle corrections. It should be noted that Y patterns have been historically known to form triangle patterns in their own right.

DOT/USDT 9-Hour Chart
Polkadot price still has more consolidation underway as triangles typically contain at least five waves (A to E) and both the D and E waves have yet to unfold. The prospective triangle sets a squeezing range of about 7% and should unfold with low volatility.
With that being said, traders should not open a position on Polkadot price until the triangle's structure is complete.
A break above $19 will likely invalidate the unfolding triangle. Should this happen, the bulls will likely take control and send the Polkadot price back into $20 and $22, which is 25% above today's opening candle.
Author

FXStreet Team
FXStreet


