- Polkadot price is forming a complex correction.
- DOT has made impulsive rallies in both directions.
- Traders should wait for more confirmation before forecasting future trend's direction.
Polkadot price looks to be coiling into a triangle formation currently unfolding as a Y wave within a larger WXY correction. This consolidation is squeezing the DOT price under low volatility, which is valid for a no-trade zone until further confirmation is displayed.
Polkadot price squeezes into consolidation mode
Polkadot price has been one of the more challenging assets to keep track of this year. From January 26 to February 6, a 46% bull run took place. Shortly after, a 65% correction took place as the bulls capitulated to a low of $14.
Elliot Wave analysis suggests that directional trends are typically started by impulse moves where waves one, three and five go with the trend, while two and four go against it. Another critical rule for wave theory is that the fourth wave cannot overlap into the territory of the first with one exception being a leading diagonal.
On the four-day chart, Elliott Wave analysts could argue that the bull rally that took place was either impulsive or a leading diagonal depending on what time frame was used. What makes analyzing the Polkadot price more challenging, is that the downside correction invalidates the bull run's impulse by taking out the low. It's also worth noting that the 65% sell off also unfolded in five clean waves as well.
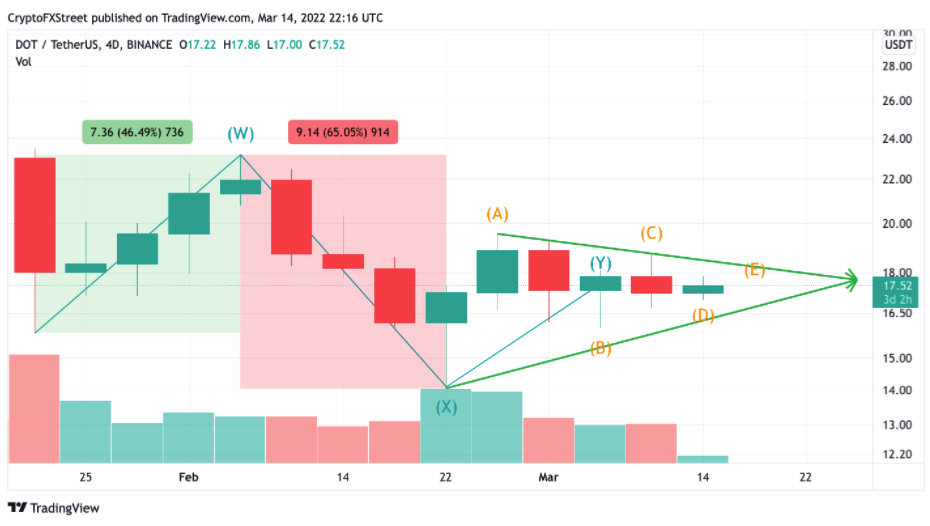
DOT/USDT 4-Day Chart
Because one can qualify either of the previous trends as impulsive waves, the most likely explanation for Polkadot price is that the digital asset is likely forming a larger complex WXY correction.
Jumping down to the 9-hour chart gives further validation for this idea. For one, the 9-hour chart depicts the W wave as impulsive, where the fourth wave barely progressed forward without overlapping the first wave. Secondly, the current unfolding Y pattern is also coiling in a three-wave swing-like manner, typical for triangle corrections. It should be noted that Y patterns have been historically known to form triangle patterns in their own right.
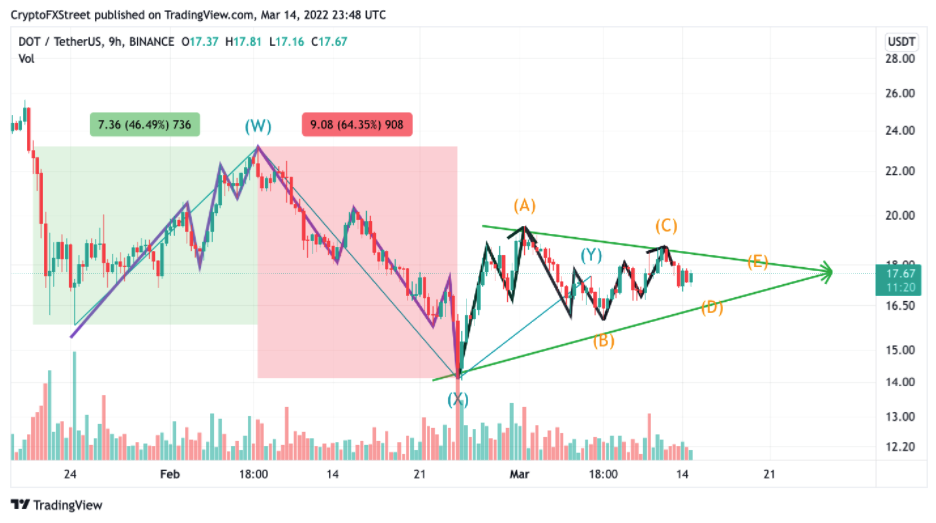
DOT/USDT 9-Hour Chart
Polkadot price still has more consolidation underway as triangles typically contain at least five waves (A to E) and both the D and E waves have yet to unfold. The prospective triangle sets a squeezing range of about 7% and should unfold with low volatility.
With that being said, traders should not open a position on Polkadot price until the triangle's structure is complete.
A break above $19 will likely invalidate the unfolding triangle. Should this happen, the bulls will likely take control and send the Polkadot price back into $20 and $22, which is 25% above today's opening candle.
Information on these pages contains forward-looking statements that involve risks and uncertainties. Markets and instruments profiled on this page are for informational purposes only and should not in any way come across as a recommendation to buy or sell in these assets. You should do your own thorough research before making any investment decisions. FXStreet does not in any way guarantee that this information is free from mistakes, errors, or material misstatements. It also does not guarantee that this information is of a timely nature. Investing in Open Markets involves a great deal of risk, including the loss of all or a portion of your investment, as well as emotional distress. All risks, losses and costs associated with investing, including total loss of principal, are your responsibility. The views and opinions expressed in this article are those of the authors and do not necessarily reflect the official policy or position of FXStreet nor its advertisers. The author will not be held responsible for information that is found at the end of links posted on this page.
If not otherwise explicitly mentioned in the body of the article, at the time of writing, the author has no position in any stock mentioned in this article and no business relationship with any company mentioned. The author has not received compensation for writing this article, other than from FXStreet.
FXStreet and the author do not provide personalized recommendations. The author makes no representations as to the accuracy, completeness, or suitability of this information. FXStreet and the author will not be liable for any errors, omissions or any losses, injuries or damages arising from this information and its display or use. Errors and omissions excepted.
The author and FXStreet are not registered investment advisors and nothing in this article is intended to be investment advice.
Recommended Content
Editors’ Picks
Trust Wallet with over 100 million users back on Google Play Store after temporary removal

Trust Wallet is a non-custodial software wallet that allows traders to send, receive, exchange and hold digital assets. Users can hold cryptocurrencies and NFTs in their Trust Wallets. The wallet disclosed its removal from Google’s application store, Play Store, early on Monday.
Maker loses 9% in past 24 hours as whales sell MKR for profits

Maker (MKR) wiped out 9% of its value in the past 24 hours. Data from crypto intelligence tracker Santiment shows that large wallet investors are taking profit on their MKR holdings, likely driving down the asset’s price.
Week Ahead: Bitcoin could surprise investors this week Premium

Two main macroeconomic events this week could attempt to sway the crypto markets. Bitcoin, which showed strength last week, has slipped into a short-term consolidation. However, a shift in momentum could soon bring forth a momentary rally for BTC and altcoins.
XRP slides to $0.50 as ETHgate controversy resurfaces, Ripple CTO debates impact on litigation

Ripple (XRP) loses all gains from the past seven days, trading at $0.50 early on Monday. XRP holders have their eyes peeled for the Securities and Exchange Commission (SEC) filing of opposition brief to Ripple’s motion to strike expert testimony.
Bitcoin: BTC’s next breakout could propel it to $80,000 Premium

Bitcoin’s (BTC) recent price consolidation could be nearing its end as technical indicators and on-chain metrics suggest a potential upward breakout. However, this move would not be straightforward and could punish impatient investors.