Solana Price Prediction: The truth no trader will tell you
- Solana price printed a classical evening star pattern on the 2-week chart.
- The most recent bearish engulfing decline wiped out six weeks of uptrend gains.
- Invalidation of the bearish thesis is a breach above $48.42.

Solana price shows a strong bearish influence on higher time frames. Key levels have been identified as the invalidation level is vital.
Solana price hints at more decline
Solana price accomplished an impressive 85% countertrend rally to a high of $48.42 during the summer. Unfortunately, the bears stepped back with supreme strength, as the bears managed to breach the ascending trend line that provided support throughout the summertime bull run. As a result of the breach, the bears sealed the deal forging a 2-week closing candle at $20.41.
Solana price currently auctions at $32.29 as the bulls are struggling to showcase a retaliation. The newfound bearish engulfing candle attributed to a 35% decline, which wiped out six weeks of an uptrend for the Solana price.
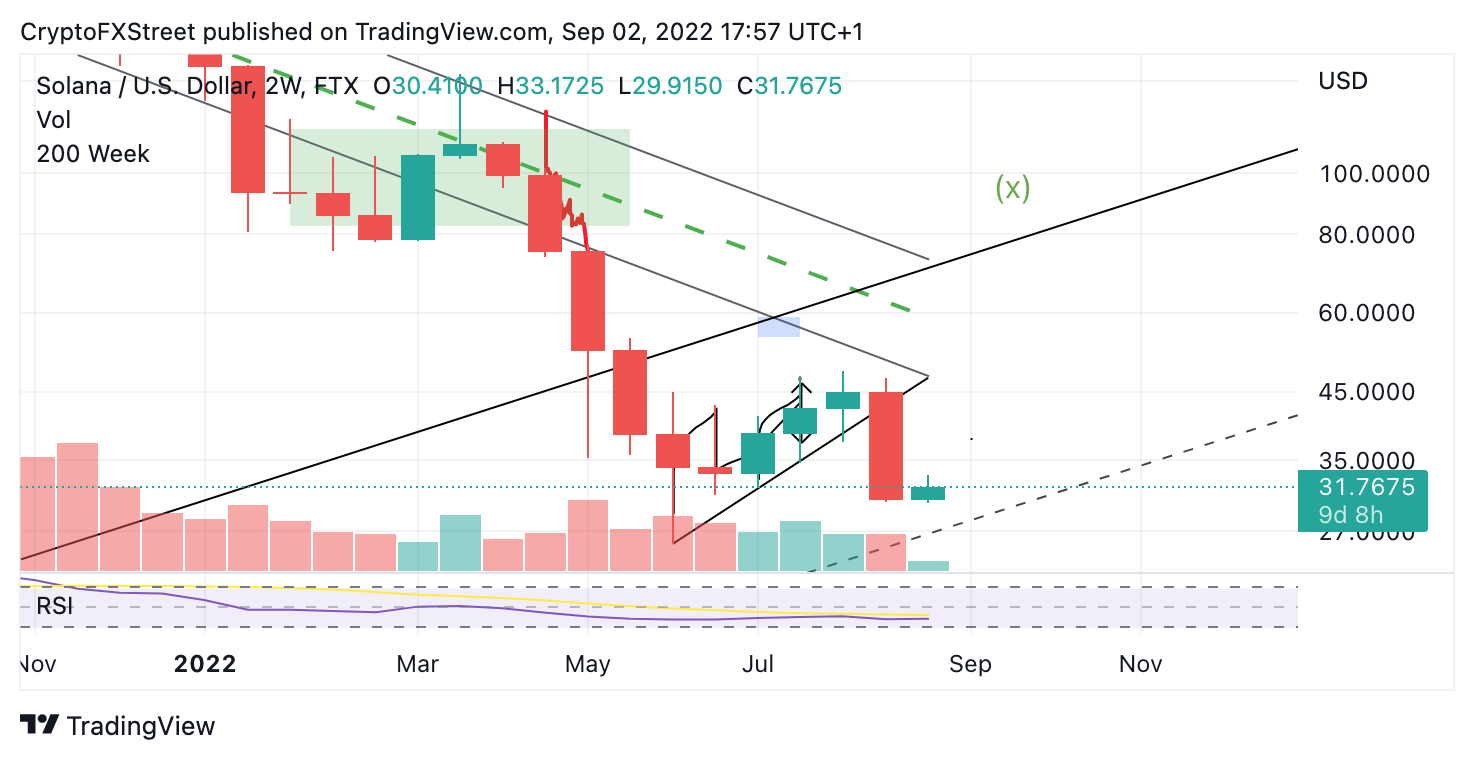
SOL/USD 2-week chart
In addition to the loss of funds, the bearish candle is the final piece to an evening-star pattern. The classical trading pattern can be used to forecast lower targets. If the technicals are correct, the bears are likely in full control and an additional plummet into the $29 barrier is now on the table.
Invalidation of the bearish thesis is a breach above the shooting star high at $48.42. Investors should also remember that a breach above the invalidation could potentially induce a rally towards $120, resulting in a 200% increase from the current Solana price.
In the following video, our analysts deep dive into the price action of Solana, analyzing key levels of interest in the market - FXStreet Team
Author

Tony M.
FXStreet Contributor
Tony Montpeirous began investing in cryptocurrencies in 2017. His trading style incorporates Elliot Wave, Auction Market Theory, Fibonacci and price action as the cornerstone of his technical analysis.


