Polygon's MATIC price signals hard times to come, here's why
- MATIC price shows an increase in bearish volume.
- Polygon price shows a classical shooting star pattern on the 3-Day chart.
- Invalidation of the bearish decline is a breach above $0.60.

Polygon’s MATIC price signals bears have re-entered the market. If the profit-taking continues, a cataclysmic fall could occur to breach the $0.31 lows.
MATIC Price shows early bulls are in trouble
Polygon's MATIC price could justify the old traders saying that "early buys quickly die" as the price threatens a breach into the mid $0.40 barrier. Since the middle of June, MATIC has been a crypto outperformer, rallying 100% in just one week. A Fibonacci retracement tool surrounding the June 18 swing low at $0.31, into June 23 high at $0.63, shows the bears have already lost 38% of profits since the impressive rally.
Polygon's MATIC price currently trades at the psychological $0.50 barrier. The bears show an increase in volume on the 3-day chart, which confounds the idea that MATIC price will soon fall into lower Fib targets, presumably the 61.8% Fibonacci level at $0.48. If the bulls do not show up to support the lower fib levels, the potential for an uptrend will be in jeopardy and provide confidence for a sweep the lows event to occur, targeting $0.31.
A classical shooting star pattern is, at the current time of writing, just 2-hours from printing on the 3-day chart. Its confirmation would reaffirm the idea that MATIC price will experience hard times shortly.
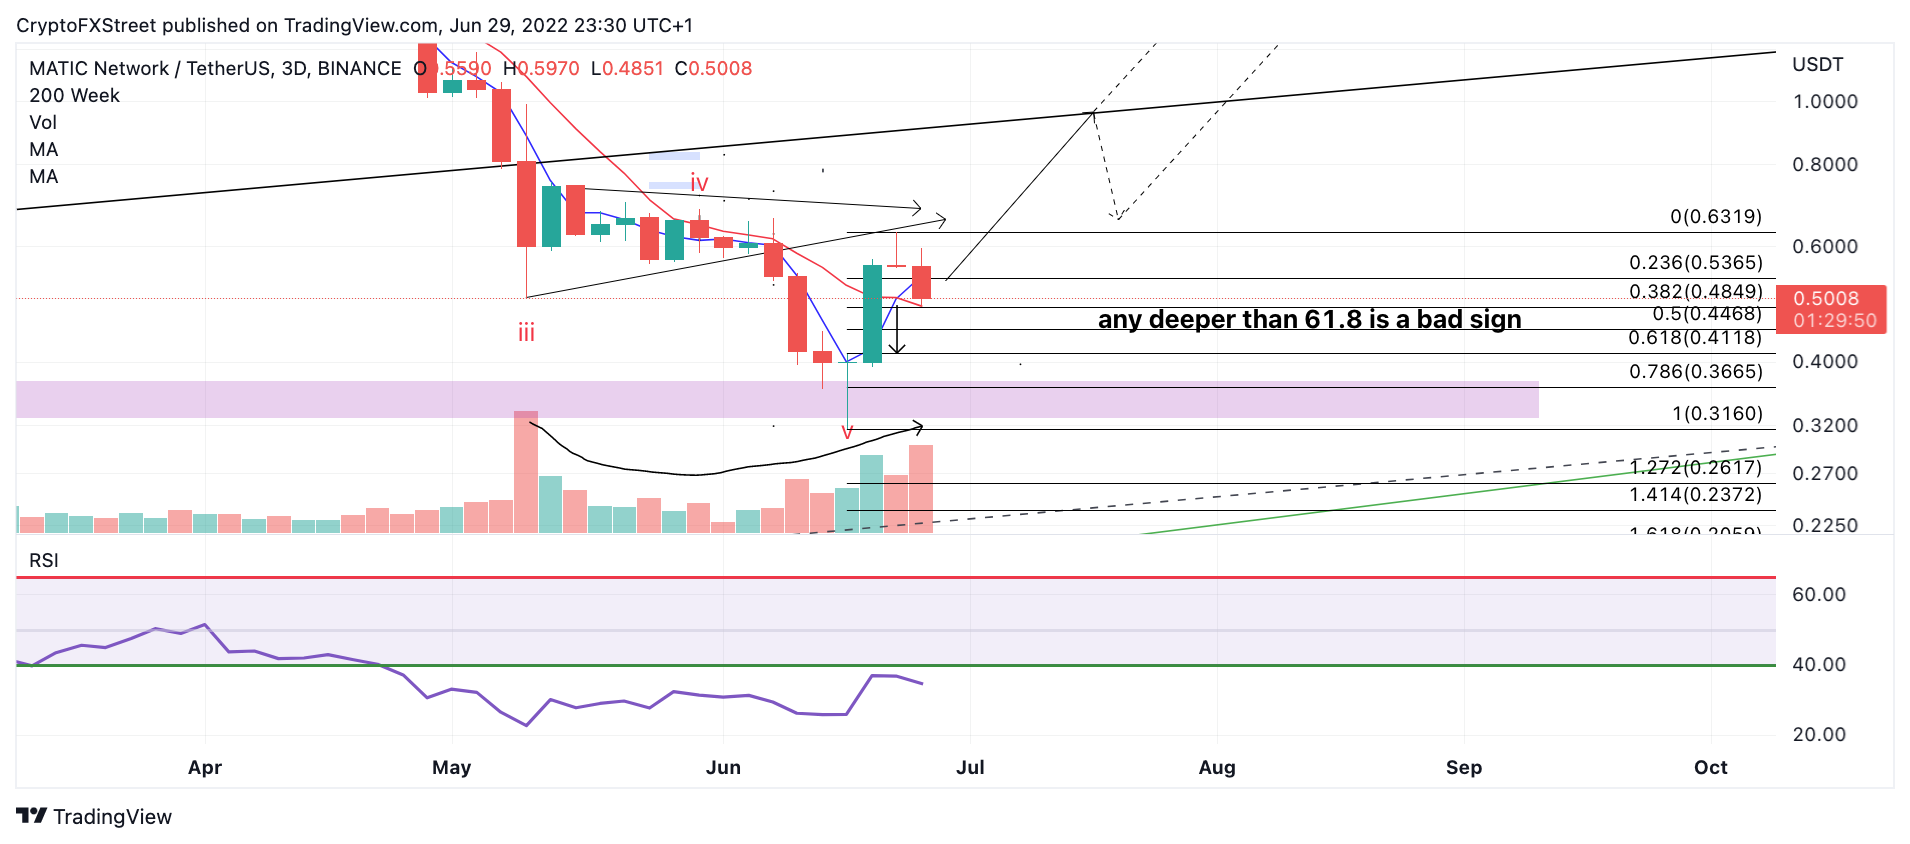
MATIC/USDT 3-Day Chart
Still, having an invalidation point will be vital as early market conditions are known to be increasingly volatile near psychological levels. Invalidation of the downtrend will be a breach above $0.60. If the bulls can re-hurdle this price point, they should have enough to stream to rally towards $0.91, resulting in a 90% increase from the current MATIC price.
Author

Tony M.
FXStreet Contributor
Tony Montpeirous began investing in cryptocurrencies in 2017. His trading style incorporates Elliot Wave, Auction Market Theory, Fibonacci and price action as the cornerstone of his technical analysis.




