The Graph Price Forecast: GRT mulls an over 30% upswing as it nears crucial demand barrier
- The Graph price is trading at the lower trendline of an ascending parallel channel.
- A bounce from here could trigger GRT into a 30% upswing to $2.2.
- Transactional data shows stiff resistance ahead that could prevent a swift move upward.

The Graph price has been trading inside an ascending parallel channel for almost a month. A bounce from the lower trendline could kickstart a bull rally for GRT.
The Graph price waddles near a critical level
GRT has been forming higher highs and higher lows since February 23. An ascending parallel channel forms by connecting the swing highs and lows using trendlines. Although this setup forecasts a bearish outlook, the Graph price has not breached the lower boundary yet.
Hence, expecting a bounce from the lower trendline seems likely. In such a case, The Graph price could see a 30% bull rally to the local top at $2.2. However, this trajectory will not be a cakewalk due to the 23.6% Fibonacci retracement level at $1.83.
Therefore, bulls need to push the Graph price through this supply barrier to reconfirm GRT’s bullish potential.

GRT/USDT 4-hour chart
While the upside scenario seems likely, it is not fixed. In case of a breach of the parallel channel’s lower trendline, the Graph price could be in for a steep correction.
Supporting the bearish scenario is IntoTheBlock’s In/Out of the Money Around Price (IOMAP) model, which shows little to no support for The Graph price.
On the other hand, IOMAP cohorts reveal relatively strong resistance levels from $1.73 to $1.93. In this range, nearly 11,500 addresses that purchased 161.43 million GRT are “Out of the Money” and might sell their holdings to break even if the Graph price ever rises.
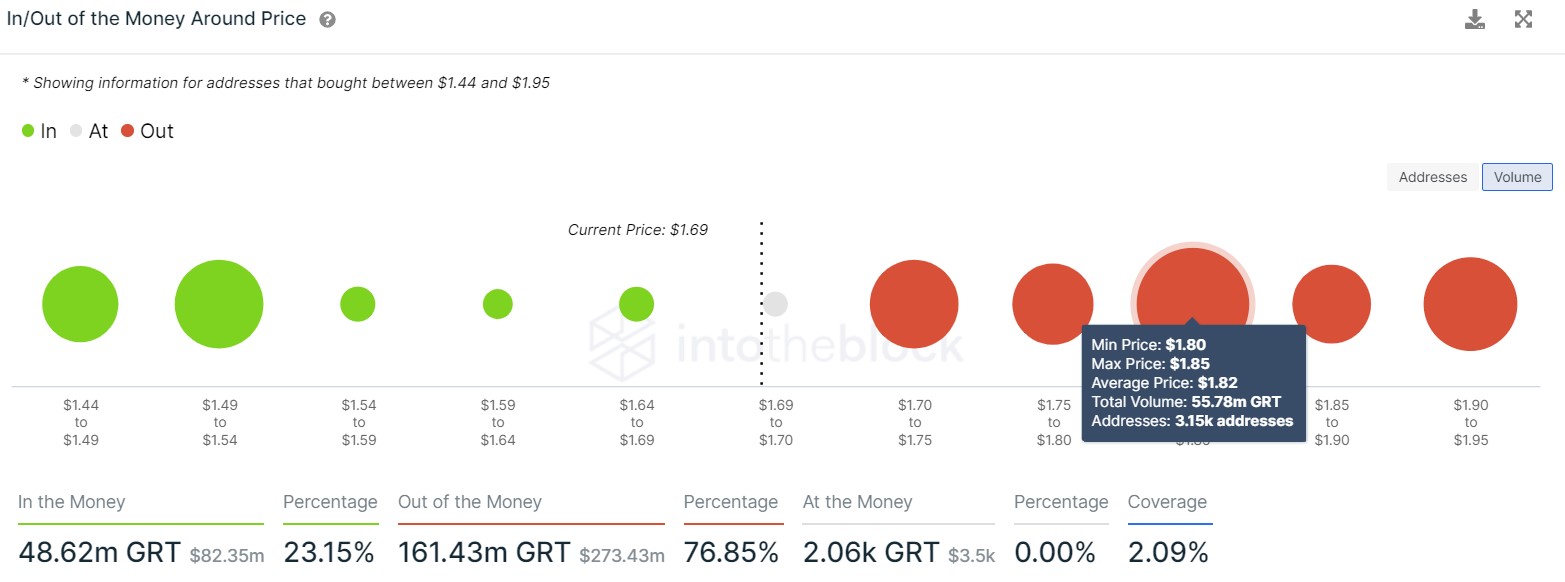
The Graph IOMAP chart
Hence, a breach of the ascending parallel channel setup at $1.64 could see the Graph price drop 9% to $1.49 or 16% to $1.36.
As seen in the 4-hour chart, the aforementioned price points are 50% and 61.8% Fibonacci retracement levels and serve as stable demand barriers.
Author

Akash Girimath
FXStreet
Akash Girimath is a Mechanical Engineer interested in the chaos of the financial markets. Trying to make sense of this convoluted yet fascinating space, he switched his engineering job to become a crypto reporter and analyst.


