- Terra Classic price is set to tank over 10% for the week as bulls break teeth on the price cap.
- LUNC turns to the downside in search of support.
- With the market turmoil forecasted for next week, a test and break below the 55-day Simple Moving Average looks granted.
Terra Classic (LUNC) price action has been trading higher before the start of 2023 as an outlier where other cryptocurrencies were still tanking in the crypto winter. LUNC has received firm rejections on the topside, and the fade could result in more losses on the back of very packed data. Expect Wednesday and Thursday to be the most challenging trading days next week as Terra Classic price action will be testing the critical support and could break lower to the downside towards $0.000127363.
Terra Classic price action set to tank back to 2022
Terra Classic price sees traders already gearing up for a very heavy and eventful week. After a winning streak of four weeks, sentiment started to turn slightly last week with nearly a flat close. That same week, bulls received a firm rejection on the top side, which happened again this week, which triggered massive profit-taking as bulls fled the scene to avoid getting caught in the price action for next week.
LUNC is set to face violent swings on Wednesday with the U.S. Federal Reserve and Super Thursday with the BoE and the ECB coming hours away from one another. Should those three central banks still communicate the same message that inflation is still not weakening enough and more needs to be done, LUNC could be seen tanking to the low of December last year, near $0.000127363. Indeed, when that 55-day Simple Moving Average gives way as support, it would be followed by a nosedive move as the bull trend gets broken.
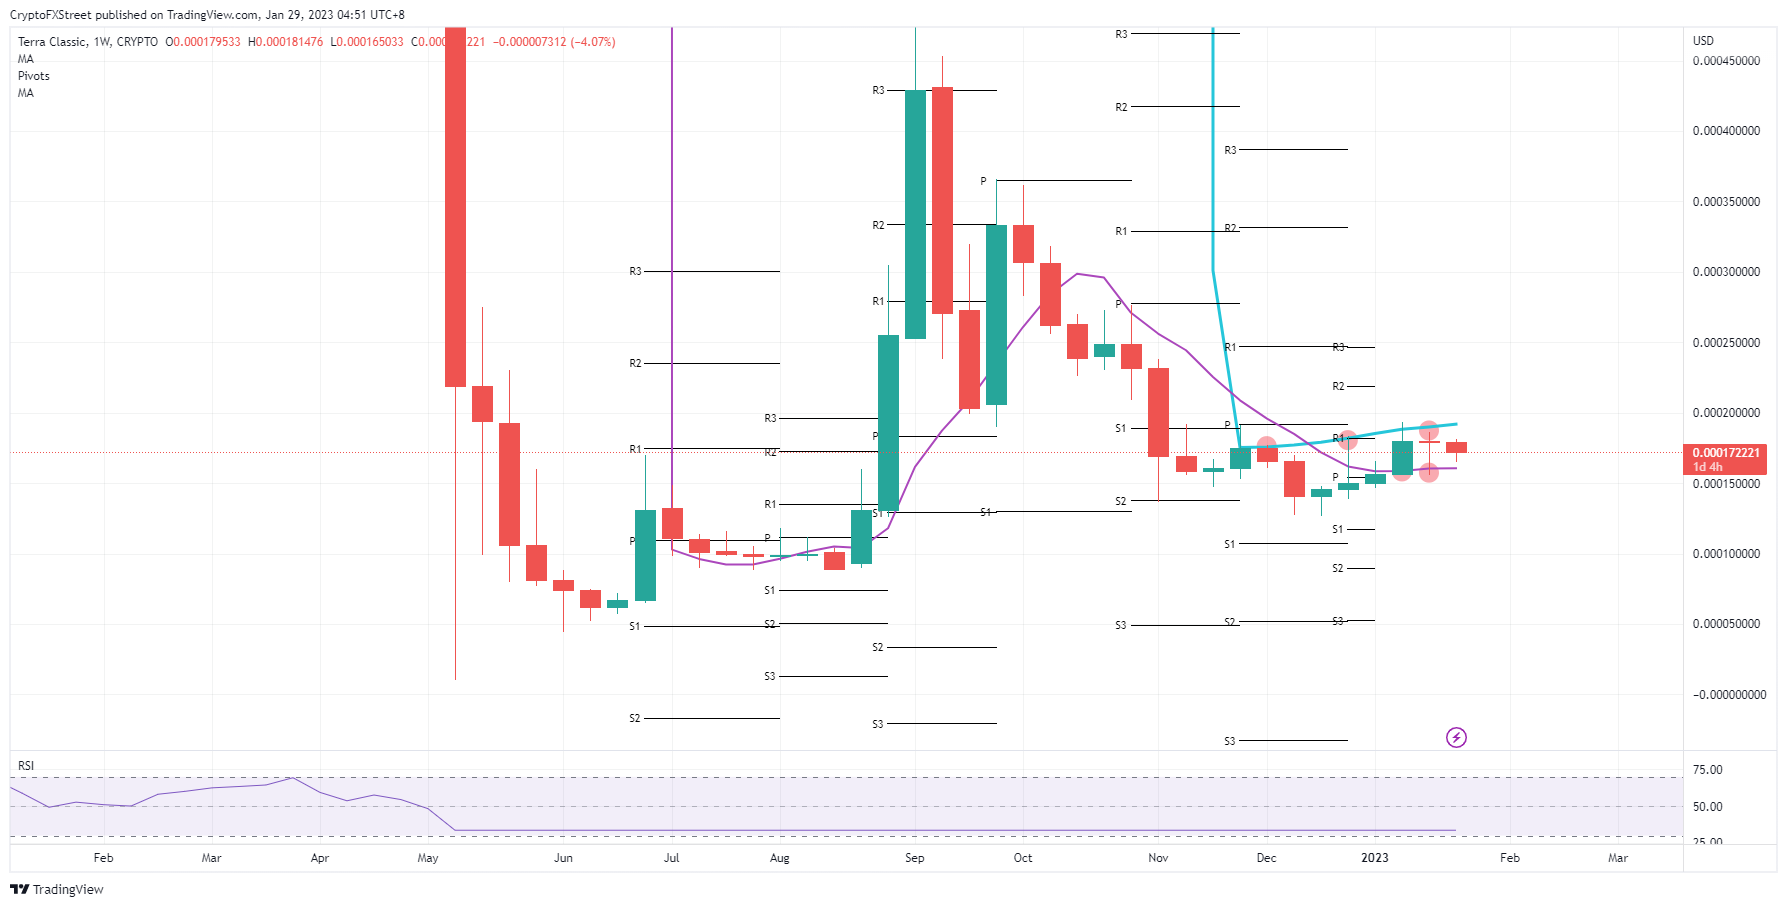
LUNC/USD weekly chart
U.S. Fed fund futures are pointing to a slowdown from the Federal Reserve and Jerome Powell. Should Powell play along with that forecast as markets price in only 25 basis point hikes, markets would turn in favor of risk assets as clearly the pivotal level for the Fed is near, and risk assets get a free ride to jump higher, with $0.000364496. That means a massive jump higher as the inflation chain would get broken.
Information on these pages contains forward-looking statements that involve risks and uncertainties. Markets and instruments profiled on this page are for informational purposes only and should not in any way come across as a recommendation to buy or sell in these assets. You should do your own thorough research before making any investment decisions. FXStreet does not in any way guarantee that this information is free from mistakes, errors, or material misstatements. It also does not guarantee that this information is of a timely nature. Investing in Open Markets involves a great deal of risk, including the loss of all or a portion of your investment, as well as emotional distress. All risks, losses and costs associated with investing, including total loss of principal, are your responsibility. The views and opinions expressed in this article are those of the authors and do not necessarily reflect the official policy or position of FXStreet nor its advertisers. The author will not be held responsible for information that is found at the end of links posted on this page.
If not otherwise explicitly mentioned in the body of the article, at the time of writing, the author has no position in any stock mentioned in this article and no business relationship with any company mentioned. The author has not received compensation for writing this article, other than from FXStreet.
FXStreet and the author do not provide personalized recommendations. The author makes no representations as to the accuracy, completeness, or suitability of this information. FXStreet and the author will not be liable for any errors, omissions or any losses, injuries or damages arising from this information and its display or use. Errors and omissions excepted.
The author and FXStreet are not registered investment advisors and nothing in this article is intended to be investment advice.
Recommended Content
Editors’ Picks
Ripple's move above this key level could trigger nearly 50% rally for XRP
Ripple has overcome a critical resistance level and flipped into a support floor on the weekly time frame. This development happened while XRP tightly consolidated for roughly 250 days. Investors can expect XRP to kickstart a massive rally.
Optimism price outlook with nearly $90 million worth of OP tokens flooding markets on Friday
Optimism volatility has shrunk in the ours leading to the network’s cliff unlock. It joins the likes of dYdX and Sui, which have similar events on their calendars. As token unlocks are often considered bearish catalysts, investors should brace for a reaction after the event.
Top 3 Price Prediction Bitcoin, Ethereum, Ripple: Retail watches from the sidelines with a bias for shorts
Bitcoin could clear $73,777 peak as BTC bulls resurface. Ethereum might fall 10% before next leg up as ETH RSI teases with sell signal. XRP could lose $0.6000 threshold as Ripple bulls fail to show up.
Jito price could hit $6 as JTO coils up inside this bullish pattern
Jito price action shows a potential cup and handle formation. Based on theoretical measurement rules, a successful breakout could yield a 56% rally to $6.0. A breakdown of the $3.86 support level would create a lower low for JTO and invalidate the bullish thesis.
Bitcoin: BTC may have recovered, but is it out of the woods?
Bitcoin’s (BTC) upward momentum has shown a significant decline for the past two weeks or so. This development led to a bearish signal on the weekly and an uncertain outlook on the monthly.