Stellar price is set for a decline as it forms a double-top
- Stellar price action shows a double-top technical formation, which tends to be followed by a bearish move.
- On-chain data paints a bearish outlook as XLM's OI-Weighted Funding Rate data is negative, and the long-to-short ratio is below one.
- A daily candlestick close above $0.1031 would invalidate the bearish thesis.
Stellar (XLM), an open-source blockchain used for various payment and remittance applications, shows a double-top formation. This pattern signals a potential trend reversal favoring the bears. Additionally, on-chain data supports this bearish move as XLM's OI-Weighted Funding Rate data and the long-to-short ratio indicate a negative bias, suggesting a decline in Stellar's price.
Stellar price is set for a downtrend as it breaks below support level
Stellar Lumens price rose and closed at $0.1031 in early August after bouncing off the $0.0933 level. From early to mid-August, it formed an M-like structure known as a double-top pattern, which often signals a potential trend reversal favoring the bears. On Wednesday, Stellar's price closed below the neckline at $0.0931, and at the time of writing on Friday, it trades slightly higher by 0.3% at $0.0933.
If the $0.0931 level holds as resistance, XLM could decline 6% to retest the August 6 low of $0.0879.
The Relative Strength Index (RSI) and the Awesome Oscillator (AO) on the daily chart trade below their neutral levels of 50 and zero, respectively. These momentum indicators strongly indicate bearish dominance and impending decline on the horizon.
If the bears are aggressive and the overall crypto market outlook is negative, XLM could close below the $0.0879 level, extending an additional 14% crash to retest its August 5 low of $0.0757.
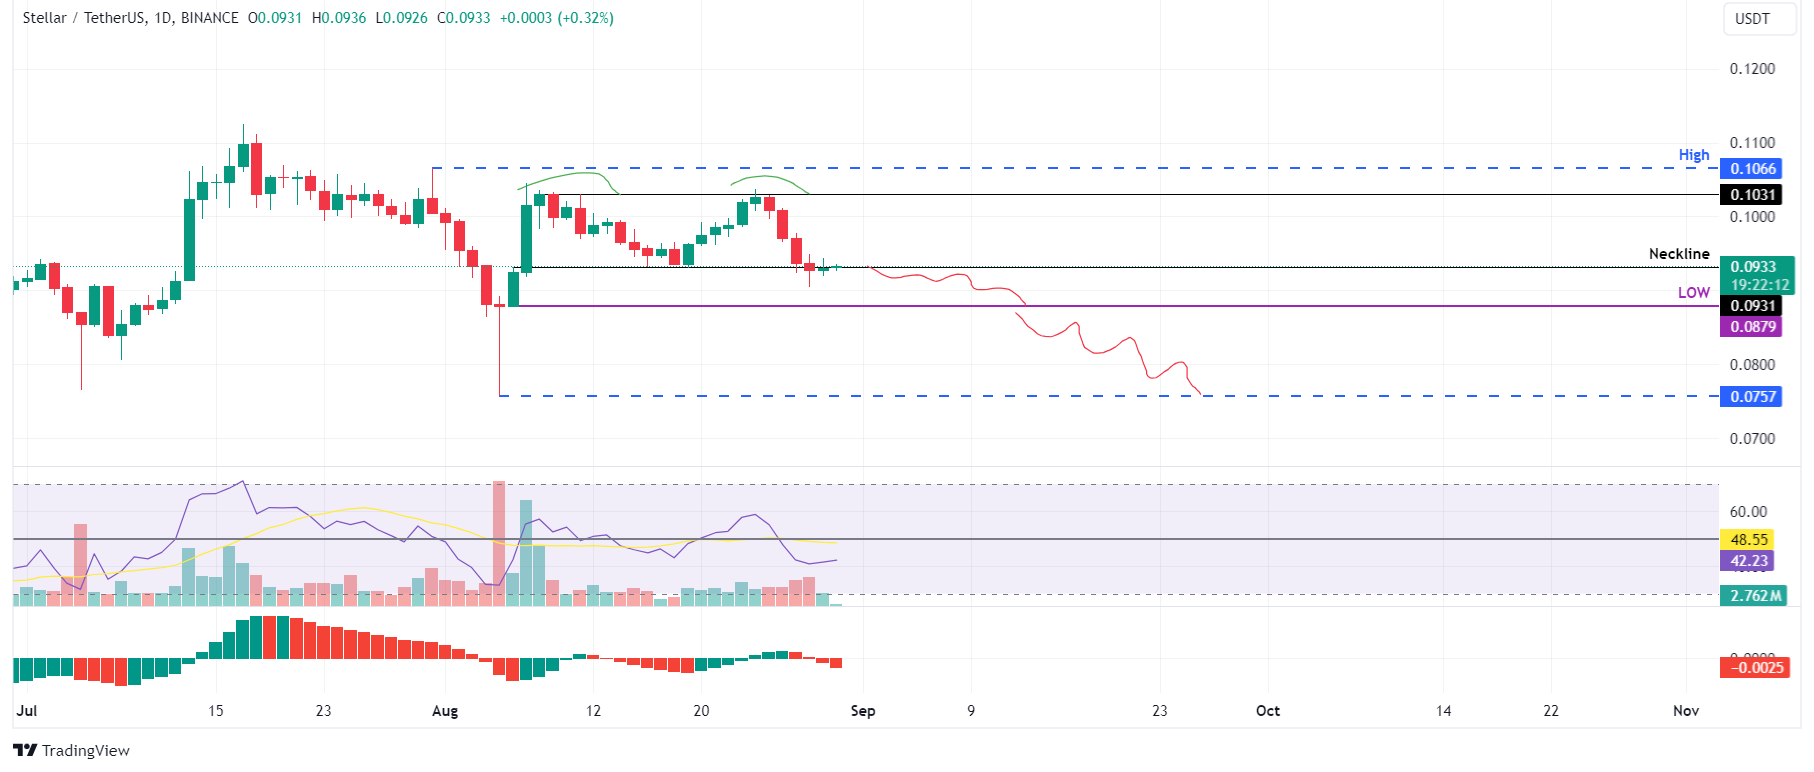
XLM/USDT daily chart
Coinglass's OI-Weighted Funding Rate data is a crucial metric for traders and analysts to assess market sentiment and predict future price movements. This metric relies on funding rates from futures contracts, weighted by their open interest. A positive rate (longs pay shorts) typically signals bullish sentiment as long positions compensate shorts. Conversely, a negative rate (shorts pay longs) indicates bearish sentiment, with shorts compensating longs.
In the case of Stellar, this metric stands at -0.0083%, reflecting a negative rate and indicating that shorts are paying longs. This scenario often signifies bearish sentiment in the market, suggesting potential downward pressure on XLM price.
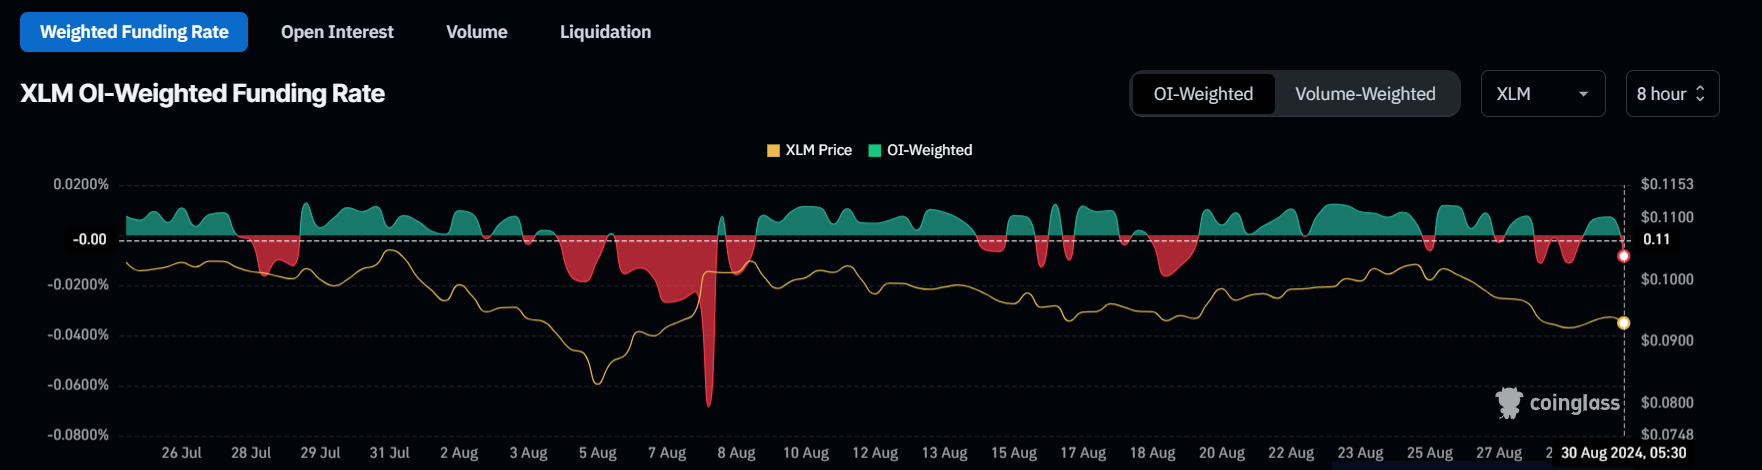
Stellar OI-Weighted Funding Rate chart
Additionally, Coinglass's data shows that XLM's long-to-short ratio stands at 0.86. This ratio reflects bearish sentiment in the market, as the number below one suggests that more traders anticipate the price of the asset to decline, bolstering Stellar's bearish outlook.
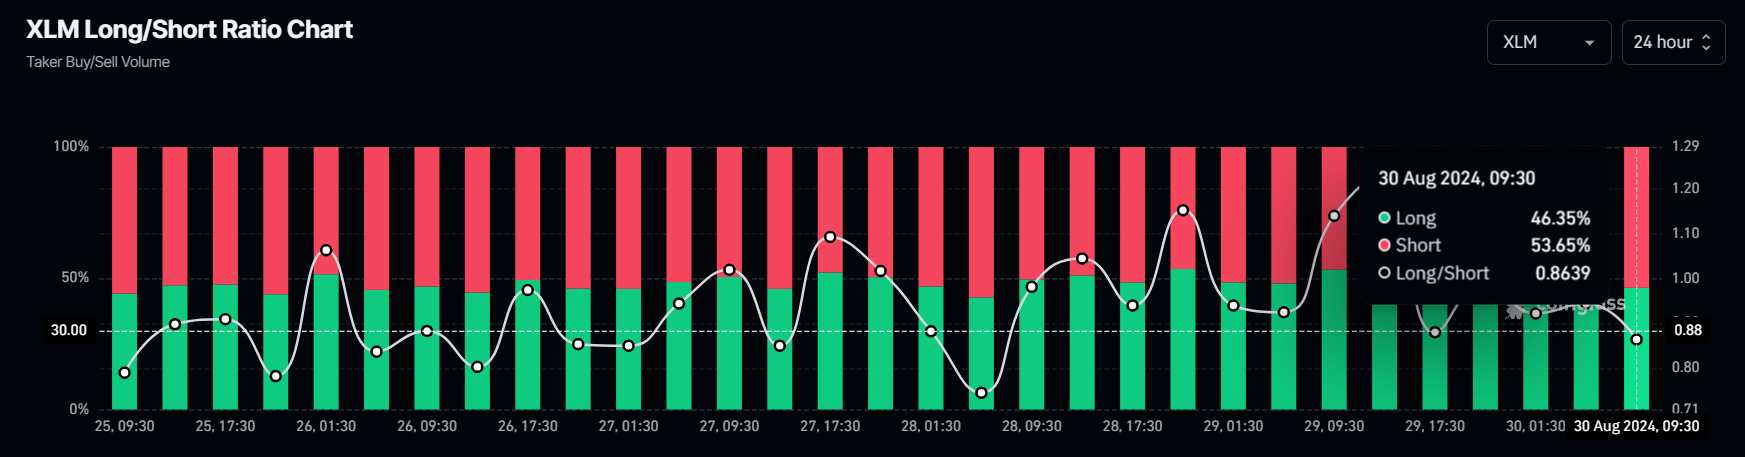
XLM long-to-short ratio chart
Despite the bearish outlook shown by technical analysis and on-chain data, if the Stellar price produces a daily candlestick close above $0.1031, it would invalidate the bearish thesis because it would post a higher high on a daily time frame. This could see Stellar's price rise by 3% to revisit the July 31 high of $0.1066.
Author

Manish Chhetri
FXStreet
Manish Chhetri is a crypto specialist with over four years of experience in the cryptocurrency industry.


