Stellar price eyes 10% fall despite growing social metrics
- Stellar price action has consolidated within a triangle chart pattern that is now at its apex.
- XLM could lose more than 7% to slide below the 200-day EMA support at $0.1127.
- Momentum indicators suggest a downtrend despite growing social dominance and social volume.

Stellar (XLM) token has indicated strong volatility over the last few months, with the price action consolidating within a triangle pattern. As the technical formation fills up, XLM is likely to break below from a technical standpoint, despite social metrics indicating growing popularity.
Stellar price eyes possible losses
Stellar (XLM) price lacks directional bias, as it fills up a rather neutral technical formation. Normally, when the price fits within this chart pattern, investors must wait for a decisive break out before they can take positions. From a technical standpoint, XLM could break below the lower boundary of the triangle soon.
Currently, the Exponential Moving Averages (EMA) remain critical for Stellar price, which sits atop the 100-day EMA at $0.1203 for support while it confronts the 50-day EMA at $0.1257. The Relative Strength Index is nose-diving, hinting at falling momentum that could see XLM flip the 100-day EMA at $0.1203 into a resistance level, before breaking below the lower boundary of the triangle. A decisive daily candlestick close below the 200-day EMA at $0.1127 would confirm the downtrend for the short term.
Notably, the RSI had just signaled a call to sell when it crossed below the signal line (yellow) band. This could increase the odds for the downside if traders heed.
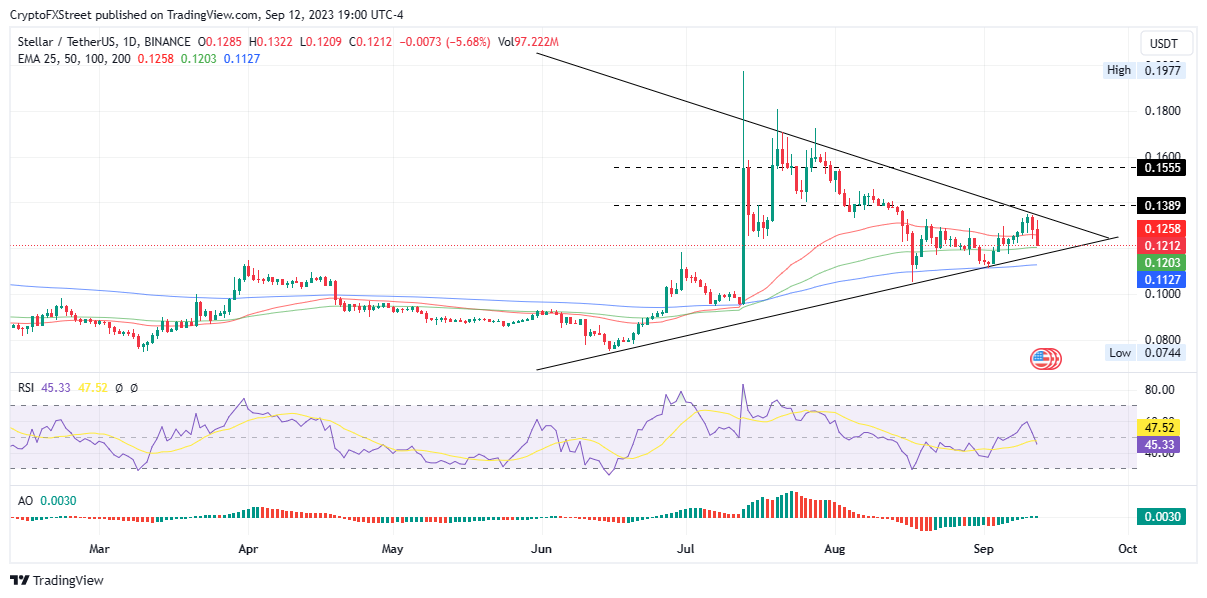
XLM/USDT 1-day chart
Conversely, the Awesome Oscillator (AO) continues to show promise. Over the last nine trading sessions, its histogram bars have steadily edged toward the positive region while maintaining their green tone. This points to more bulls flocking the scene, likely to inspire a new wave of bullish momentum to steer Stellar price.
For confirmation, Stellar price must break out from under the suppression of the upper boundary of the chart pattern and record a decisive daily candlestick close above $0.1389. In a highly bullish case, the gains could extend to the psychological $0.1600.
XLM growing social metrics
On-chain metrics from Santiment behavior aggregator tilt the scale further in favor of bulls, showing that social dominance and social metrics for XLM have recently found a pivot and are rising.
 [01.59.27, 13 Sep, 2023]-638301598441547246.png)
XLM Santiment
A rise in social dominance means the share or percentage of the coin’s mentions on crypto-based social media is increasing, relative to a pool of over 50 of the most popular projects on social media. In the same way, social volume metrics point to the amount of mentions of the coin on more than 1000 crypto-related social media channels.
With the two social metrics mirroring the token’s impressions, it tends to translate into bullish momentum, thereby favoring the upside.
Also Read: Investors bet on Stellar’s XLM as SEC comes with a vengeance on Ripple’s XRP token
Cryptocurrency metrics FAQs
What is circulating supply?
The developer or creator of each cryptocurrency decides on the total number of tokens that can be minted or issued. Only a certain number of these assets can be minted by mining, staking or other mechanisms. This is defined by the algorithm of the underlying blockchain technology. Since its inception, a total of 19,445,656 BTCs have been mined, which is the circulating supply of Bitcoin. On the other hand, circulating supply can also be decreased via actions such as burning tokens, or mistakenly sending assets to addresses of other incompatible blockchains.
What is market capitalization?
Market capitalization is the result of multiplying the circulating supply of a certain asset by the asset’s current market value. For Bitcoin, the market capitalization at the beginning of August 2023 is above $570 billion, which is the result of the more than 19 million BTC in circulation multiplied by the Bitcoin price around $29,600.
What is trading volume?
Trading volume refers to the total number of tokens for a specific asset that has been transacted or exchanged between buyers and sellers within set trading hours, for example, 24 hours. It is used to gauge market sentiment, this metric combines all volumes on centralized exchanges and decentralized exchanges. Increasing trading volume often denotes the demand for a certain asset as more people are buying and selling the cryptocurrency.
What is funding rate?
Funding rates are a concept designed to encourage traders to take positions and ensure perpetual contract prices match spot markets. It defines a mechanism by exchanges to ensure that future prices and index prices periodic payments regularly converge. When the funding rate is positive, the price of the perpetual contract is higher than the mark price. This means traders who are bullish and have opened long positions pay traders who are in short positions. On the other hand, a negative funding rate means perpetual prices are below the mark price, and hence traders with short positions pay traders who have opened long positions.
Author

Lockridge Okoth
FXStreet
Lockridge is a believer in the transformative power of crypto and the blockchain industry.


